Methods
The participants and hearing aids reported in this study are the same as that in our initial Hearing Review article.16 Thus, only a brief overview of the methods is provided here.
Participants. We recruited a total of 60 participants, with a sample size of 20 listeners in each of three groups. Participants of the “Experienced” group consisted of experienced hearing aid users (ie, >1 year of use, devices use >8 hours/daily). Participants of the “In-the-Drawer” group consisted of listeners who had previously adopted hearing aids, but were not using their devices regularly (ie, hearing aids purchased within the past 24 months, but used less than 8 hours weekly). Participants of the “First-Time” group consisted of listeners who experience hearing difficulties, yet had never attempted a trial period with hearing aids. Each participant was recruited from the greater Dallas-Fort Worth (DFW) metropolis. Study participation across groups was based on the following criteria:
1) Aged between 50 and 75 years;
2) Exhibited a symmetrical, bilateral, mild-to-moderate sensorineural hearing loss;
3) Reported a <$42,000 annual household income; and
4) Passed a cognitive screening task (ie, Mini-Mental State Exam).17
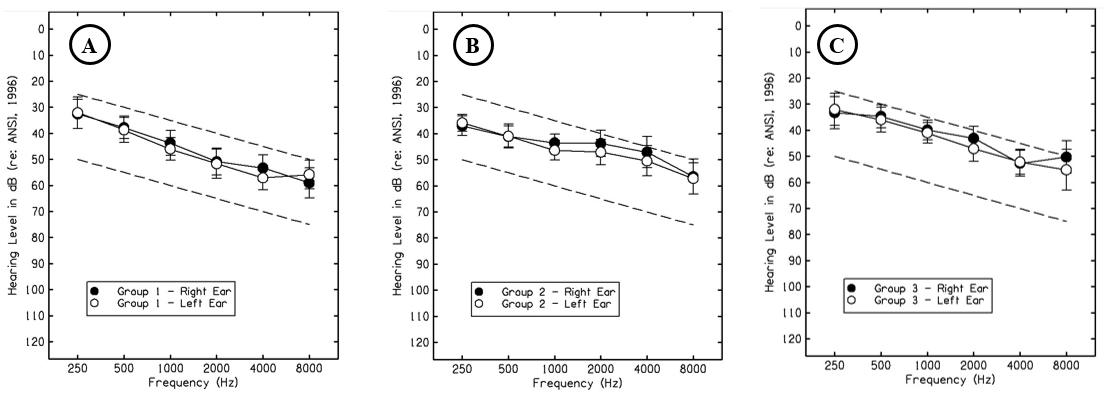
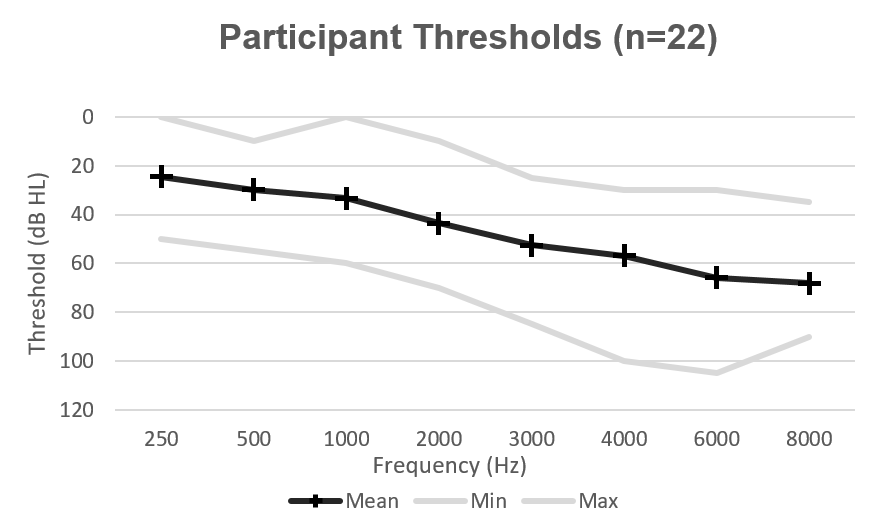
The mean age of participants was 66.8 years (SD = 5.2; 8 males, 12 females), 66.2 years (SD = 4.9; 13 males, 7 females), and 68.5 years (SD = 7.3; 10 males, 10 females), for the Experienced, In-the-Drawer, and First-Time groups, respectively. Mean audiometric data for each respective group are shown in Figures 1a-c.
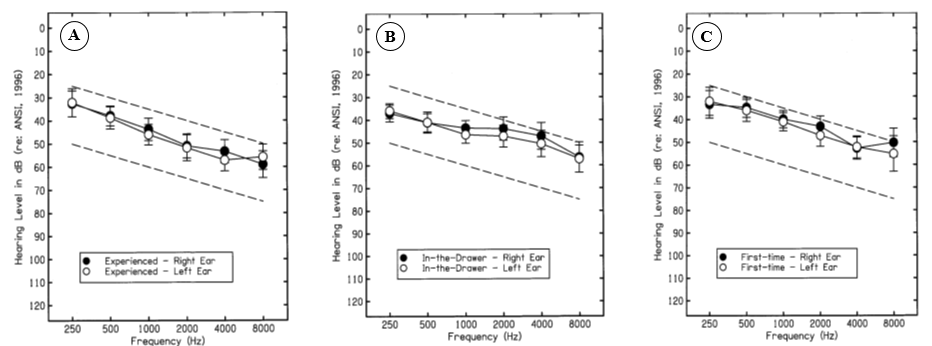
Figure 1a-c. Target audiometric threshold range (ie, dashed lines) used to recruit participants and mean audiometric threshold data, denoted by the filled (ie, right ear) and open (ie, left ear) circles, for each group evaluated in this study. Variability (ie, two standard deviations) is shown as error bars.
Hearing aid. Each participant was fit binaurally with a commercially-available, premium model receiver-in-the-canal (RIC) hearing aid from one manufacturer. This multi-memory hearing aid provided digital wide dynamic range compression (WDRC), along with speech enhancement, omni- and directional-microphone listening, feedback management, and noise reduction processed in 15 channels. Manufacturer specifications indicated a high-frequency average (HFA) maximum power output and gain of 110 and 58 dB SPL, respectively, for this device. During the study, all advanced features (eg, directionality, noise reduction) were disabled and target gain was predicted using the NAL-NL2 prescriptive approach8 in a single memory.
Loyalty survey. We assessed loyalty to the service provider using the RAPID Loyalty Survey.18 This survey consists of 10 questions and identifies three components: retention (ie, degree to which consumers remain consumers to the same business), advocacy (ie, positive perceptions that lead to advocacy of the business), and purchasing (ie, degree to which consumers will increase purchase behavior). Respondents were asked to provide a categorical response ranging from 1 (very likely) to 10 (not likely). Response ratings closer to 1 indicated increased loyalty, while responses closer to 10 indicated decreased loyalty.
Speech Intelligibility Index (SII). We assessed the potential impact of each fitting approach on speech understanding using the SII which is a measure, between 0 and 1, that captures the proportion of speech cues that are audible. Following the completion of each REM, the Verifit2 calculated and displayed the aided SII for each input level evaluated, which we subsequently entered into a database for analysis.
Procedures
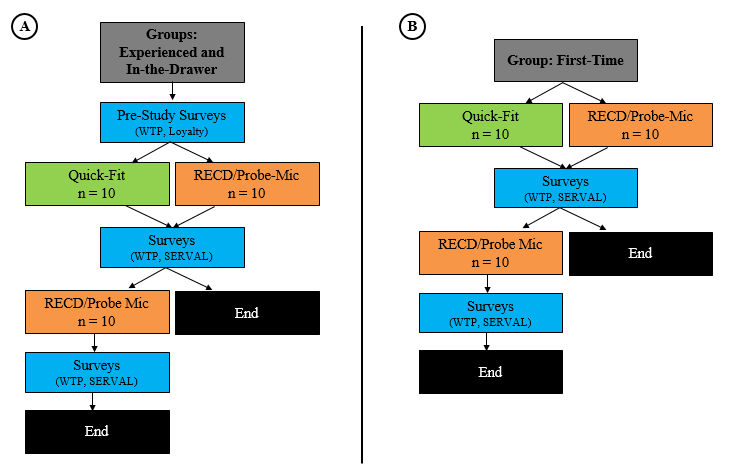
Each potential participant was provided a University of North Texas Institutional Review Board (UNT-IRB)-approved consent form prior to participation. After consenting, each participant underwent audiometric testing (ie, air- and bone-conduction thresholds, immittance measures, word-recognition performance) and the cognitive screening task. Once a participant met the requirements for participation, he/she was placed into one of the three groups assessed in this study: Experienced, In-the-Drawer, and First-Time. Figure 2 depicts the procedures used in this study for the Experienced and In-the-Drawer groups (Panel A/B), and the First-Time group (Panel B).
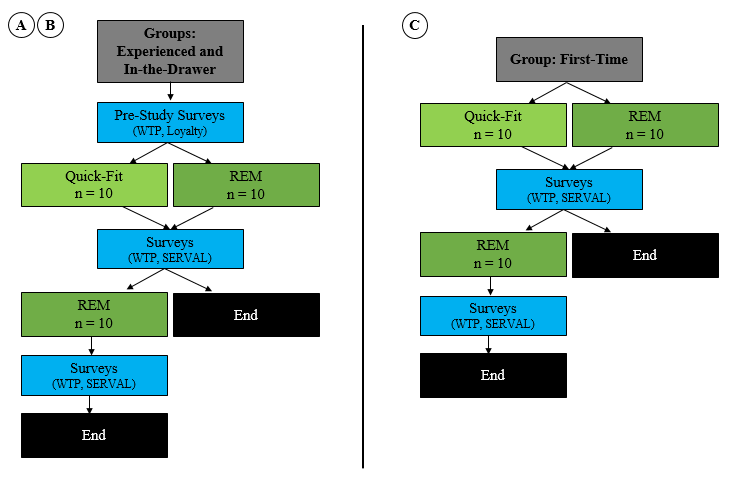
Figure 2a-c. Procedures used in this study. Panel A/B depicts the procedures provided to participants in the Experienced and In-the-Drawer groups, and Panel C shows procedures provided to participants in the First-Time group.
Pre-study. Ten (10) participants within a given group were selected randomly to receive clinical services and amplification programmed using the Quick-Fit (ie, hearing aid manufacturer first-fit) target approach, while the remaining 10 participants within the same given group received clinical services and amplification programmed based on the real-ear measurement approach (REM via Verifit Speechmap19). For participants in the Experienced and In-the-Drawer groups, who had previously experienced professional services related to amplification, we obtained their loyalty towards their previous experience. Assessing these subjective measures prior to the experiment provided us with each group’s predisposed psychological attitude and intention towards professional services.
Hearing aid programming. Participants within each group who received the Quick-Fit target approach had the experimental hearing aids programmed with the manufacturer’s fitting software to predicted NAL-NL2 target gain for experienced listeners, based only on audiometric thresholds. On the other hand, participants within each group who received the REM approach were provided clinical services where the investigator measured the listener’s real-ear-to-coupler difference (RECD) bilaterally, using the methodology included in the Audioscan manual. The RECD measurement, along with audiometric threshold data, was entered into the manufacturer’s software for the REM group resulting in an individualized NAL-NL2 prescriptive target, also designated for experienced listeners. This individualized prescriptive target was then saved to the experimental hearing aids.
Hearing aid fitting. For participants who received the Quick-Fit approach, programming adjustments to the hearing aid were made based on anecdotal responses provided by the listener. Programming adjustments ceased when the patient verbally indicated that the devices provided him/her with comfort and clarity ratings of 8 on a 10-point scale (ie, 1 = lowest, 10 = highest) while listening to passages of the Connected Speech Test (CST).20 The CST passages were presented from a personal computer (PC) connected to a loudspeaker positioned directly in front of the listener at a distance of 1 meter at a presentation level of 68 dB SPL. No REMs were made for this subgroup during this portion of the study. The participant was then asked to complete both surveys and provide responses based on the clinical services received. The surveys were counterbalanced across participants, and provided by and returned to a secondary investigator who had not provided the professional services, to reduce bias.
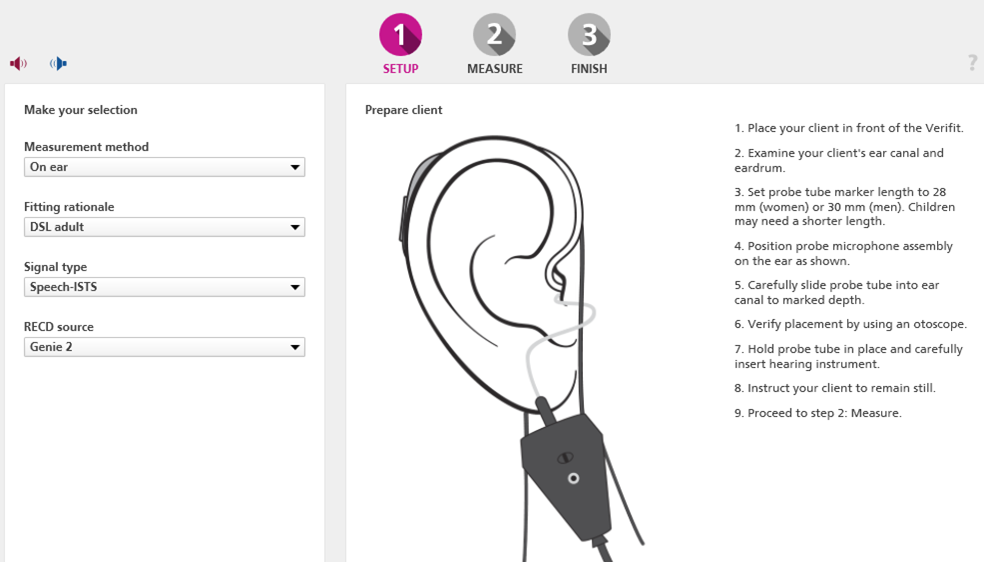
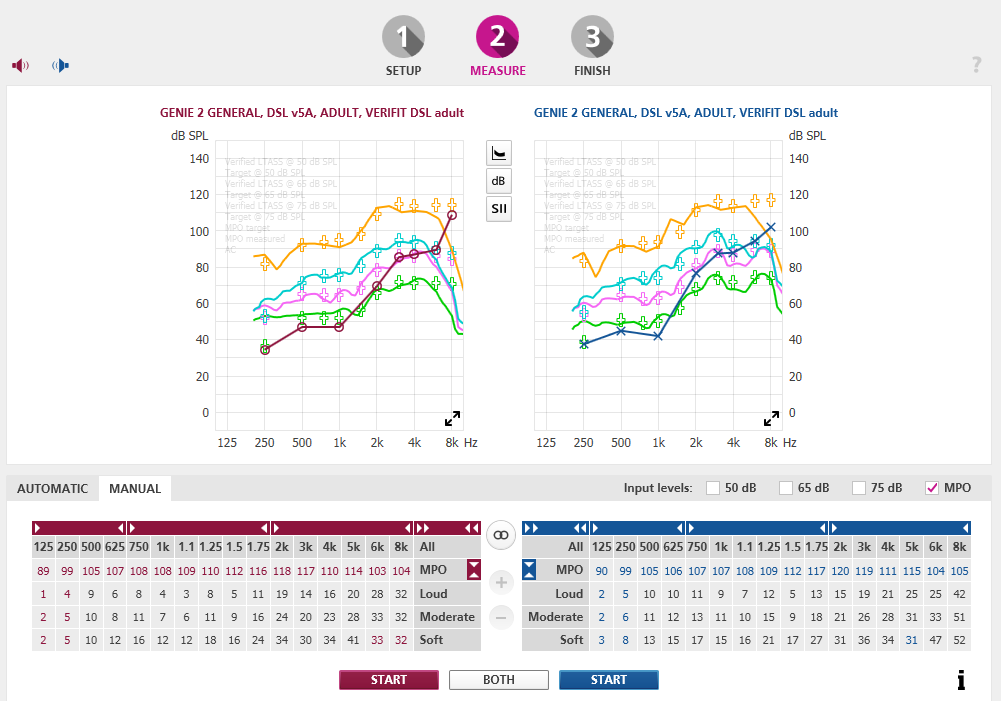
Participants experiencing the REM approach had a probe-tube inserted in their ear canal following manufacturer’s guidelines. Specifically, the subject was informed of the purpose of the procedure and what was to occur, otoscopy was conducted, and the probe housing was attached to the patient. The probe-tube was positioned within 5 mm of the eardrum using the visually assisted positioning technique. The hearing aids were placed in the ear and programming adjustments to the hearing aids were made until the real-ear aided response (REAR) was within ±3 dB of the generated NAL-NL2 targets on the Verifit2 across frequencies for each input level. Anecdotal responses were also obtained, where each participant verbally indicated that the devices programmed to the NAL-NL2 targets provided him/her with comfort and clarity ratings of 8 on a 10-point scale (ie, 1 = lowest, 10 = highest) while listening to CST passages. The CST passages were presented at the same distance, azimuth, and presentation level as described in the Quick-Fit approach. Slight adjustments (ie, within ±5 dB) were made relative to the NAL-NL2 targets in 17 of the 30 (ie, 57%) participants tested in this study.
After the hearing aids were adjusted, final REAR responses were obtained for Verifit2-generated speech signals (standard Male) at input levels of 55- (soft speech), 65- (average speech), and 75- (loud speech) dB SPL, as well as MPO. The participant was then asked to complete the loyalty survey, providing responses based on the clinical services received. The survey was provided by and returned to a secondary investigator—not associated with those providing professional services—to reduce bias.
Post-fitting. At the conclusion of the study, participants who received the Quick-Fit approach were retested, this time receiving the same REM approach provided to their within-group counterparts. Each participant also completed the loyalty survey a second time, this time based on the REM services they received at this stage of the study.
RESULTS AND DISCUSSION
Fitting to Target
Figures 3-5 demonstrate the REAR deviations by input level for each group between the REM and Quick-Fit approaches compared to the NAL-NL2 target (ie, represented as 0 dB on the y-axis). The orange and blue bars represent aided deviations for the REM and Quick-Fit approaches, respectively, plotted for the right ear. The dashed and solid lines represent left-ear aided deviations from target for the REM and Quick-Fit approaches, respectively. The results are plotted individually for the inputs of 55-, 65-, and 75-dB SPL.
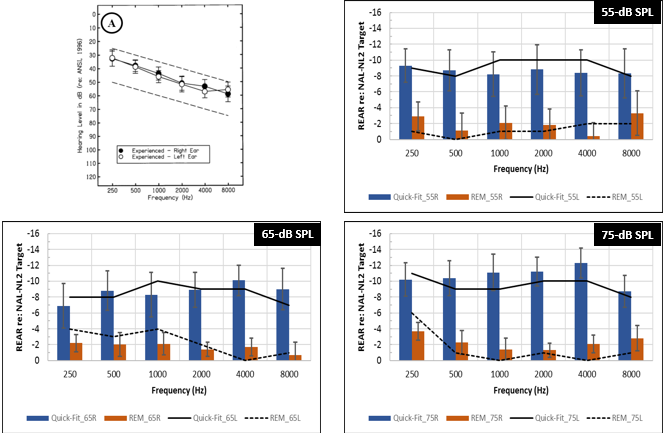
Figure 3. Experienced group. Graphic representation demonstrating the mean REAR differences obtained for the REM approach (ie, orange bars = right ear, dashed line = left ear) and Quick-Fit approach (ie, blue bars = right ear, solid line = left ear) compared to the NAL-NL2 target (ie, represented as 0 dB on the y-axis). Variability (ie, 95% confidence intervals) is shown as error bars.
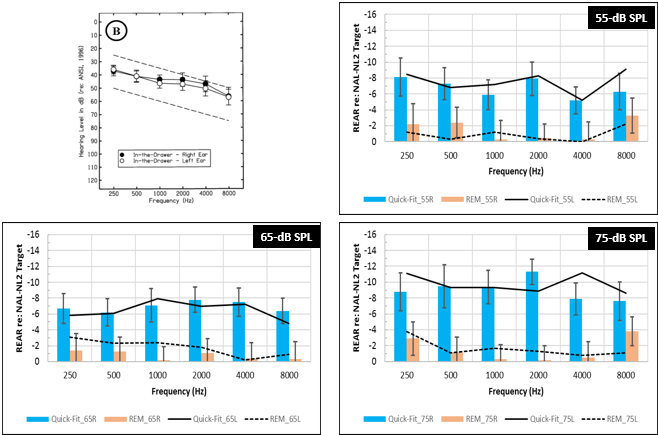
Figure 4. In-the-Drawer group. Graphic representation demonstrating the mean REAR differences obtained for the REM approach (ie, orange bars = right ear, dashed line = left ear) and Quick-Fit approach (ie, blue bars = right ear, solid line = left ear) compared to the NAL-NL2 target (ie, represented as 0 dB on the y-axis). Variability (ie, 95% confidence intervals) is shown as error bars.
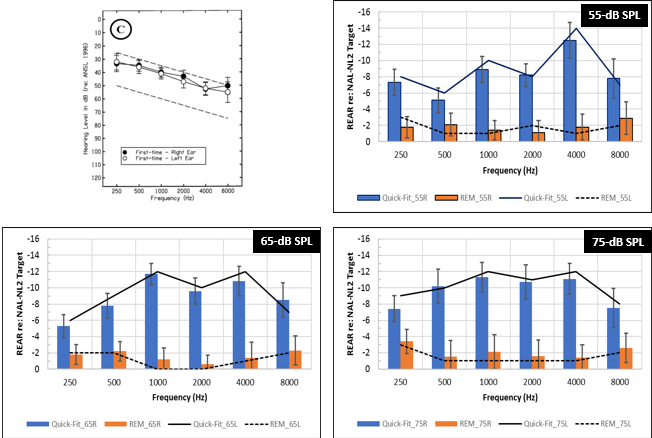
Figure 5. First-time group. Graphic representation demonstrating the mean REAR differences obtained for the REM approach (ie, orange bars = right ear, dashed line = left ear) and Quick-Fit approach (ie, blue bars = right ear, solid line = left ear) compared to the NAL-NL2 target (ie, represented as 0 dB on the y-axis). Variability (ie, 95% confidence intervals) is shown as error bars.
For the Experienced group (Group A, Figure 3), results revealed that the Quick-Fit approach (ie, blue bars = right ear, solid lines = left ear) provided roughly 8.9, 8.7, and 10.2 dB less gain when averaged across both ears at inputs of 55-, 65-, and 75-dB SPL across frequencies, respectively, compared to the prescribed NAL-NL2 targets. Conversely, the REM approach (orange bars = right ear, dotted line = left ear) approximated targets more closely, underfitting targets by roughly 1.6, 1.9, and 2.0 dB when averaged across both ears. The results reveal consistency in findings across ears (right ear = bars, left ear = lines), showing symmetrical deviation trends from target across frequencies for each intensity for each fitting method. Similar trends are seen for the In-the-Drawer (Group B) and First-Time (Group C) groups. For the In-the-Drawer group, the Quick-Fit approach provided 7.2 and 6.2 dB less gain when averaged across both ears at 55- and 65-dB SPL, respectively, and 9.4 dB less gain when averaged across both ears at 75-dB SPL, compared to the NAL-NL2 target (Figure 4). Conversely, for the REM approach, mean REARs, when averaged across ears, deviated from target by 1.2, 1.3, and 1.6 dB at 55-, 65-, and 75-dB SPL respectively.
For the First-Time group, the Quick-Fit approach provided 8.6 and 9.3 dB less gain when averaged across ears at 55- and 65-dB SPL, respectively, and 10 dB less gain across ears at 75-dB SPL, compared to the NAL-NL2 targets (Figure 5). In comparison, the REM approach (orange bars = right ear; dotted line = left ear) deviated from targets by an average of 1.5 to 2 dB across ears for the three input levels. For both groups, REAR data was symmetrical between ears for each input level for each fitting method.
Author’s note: Findings with the REM condition revealing relatively small deviations from target were anticipated given that several participants requested small programming changes (~±5 dB from target) based on their sound quality preference, as previously described in the fitting procedure protocol. The audiological values for all three groups (Figures 3-5) are also provided in tables in the online version of this article at hearingreview.com.
Audibility Assessment with the SII
Following each REAR measurement, the Verifit2 calculated the speech intelligibility index (SII).12 The SII is a measure of the proportion of speech information that is audible to the listener, ranging between 0.0 and 1.0, where higher values represent a greater proportion of audible speech cues. There is also a monotonic relationship between SII (ie, audibility) and speech understanding; that is, as the SII is increased, speech understanding is also expected to increase.
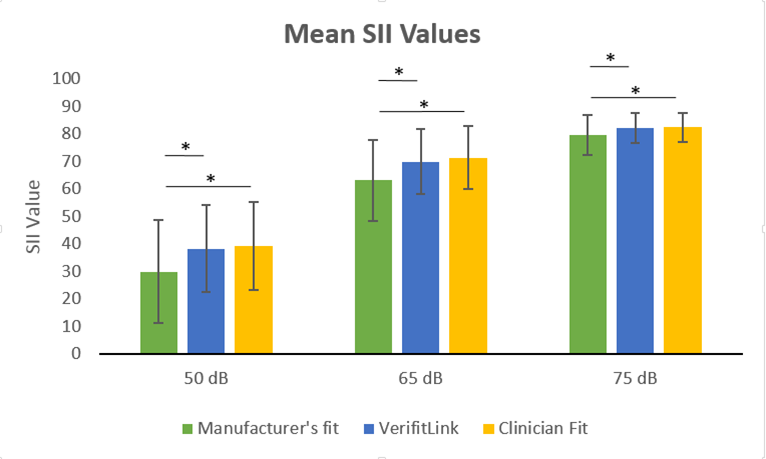
Figures 6-8 show the mean amount of audibility (per the SII) within a 95% confidence interval (CI95) for the: 1) NAL-NL2 target, as displayed on the Verifit2; 2) REAR based on the Quick-Fit approach, and 3) REAR based on the REM approach, as a function of intensity level (ie, 55-, 65-, 75-dB SPL) and across groups.
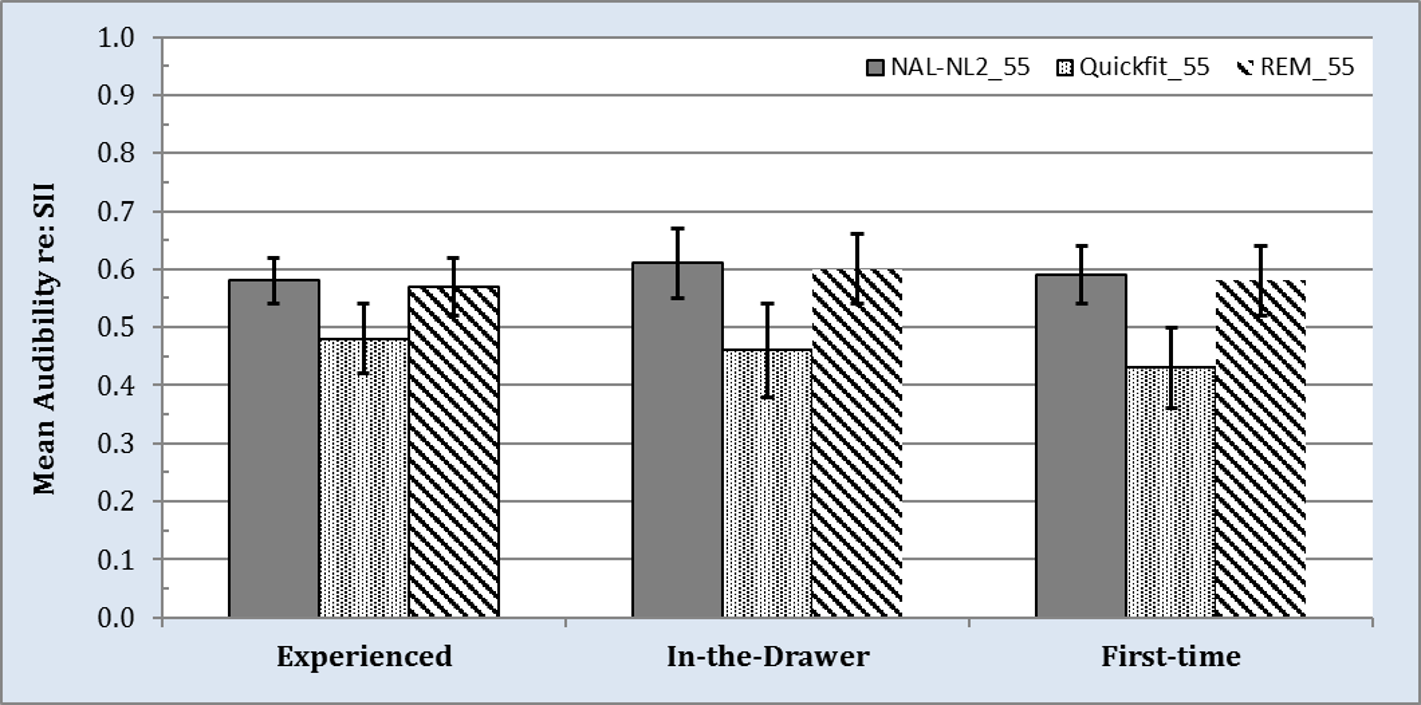
Figure 6. Speech intelligibility index (SII) values obtained at a 55-dB input level for NAL-NL2 targets provided by Verifit2 (ie, gray bars), Quick-Fit approach (ie, black and white dotted bars), and REM approach (ie, black and white downward striped bars). Variability (ie, 95% confidence intervals) is shown as error bars.
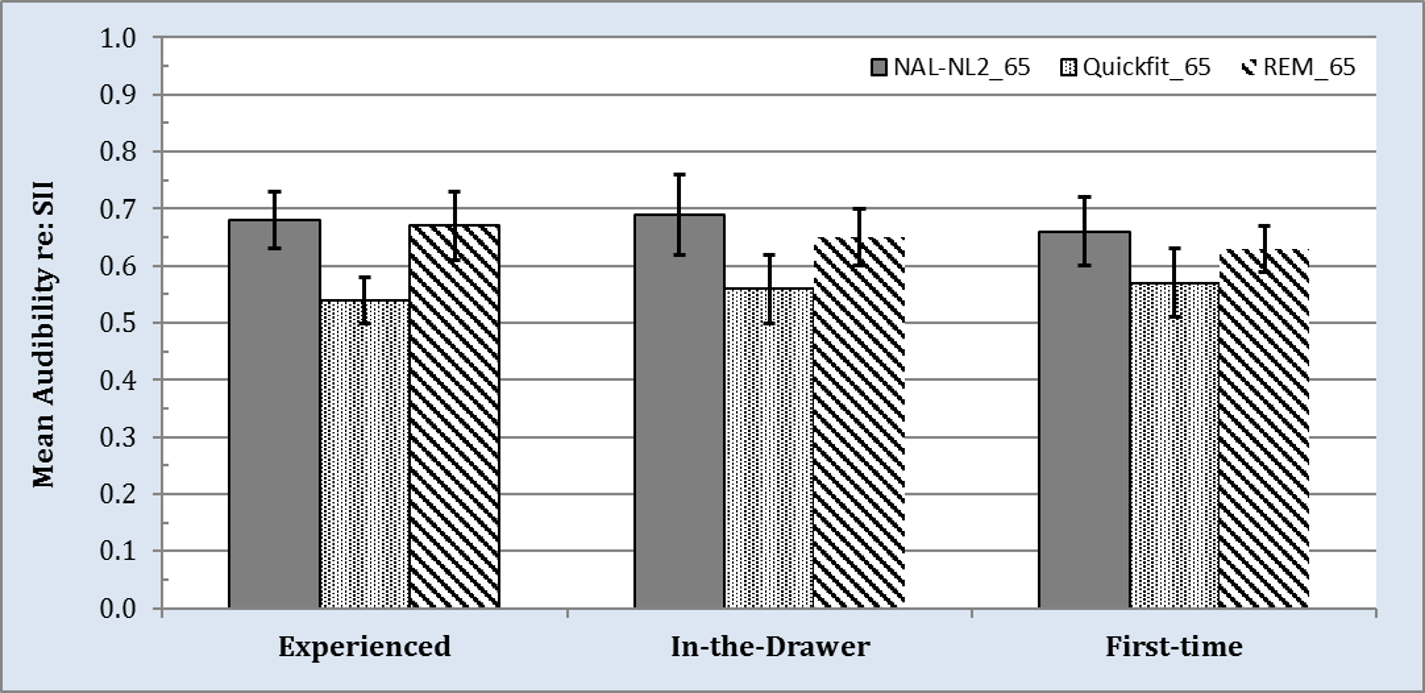
Figure 7. Speech intelligibility index (SII) values obtained at a 65-dB input level for NAL-NL2 target provided by Verifit2 (ie, gray bars), Quick-Fit approach (ie, black and white dotted bars), and REM approach (ie, black and white downward striped bars). Variability (ie, 95% confidence intervals) is shown as error bars.
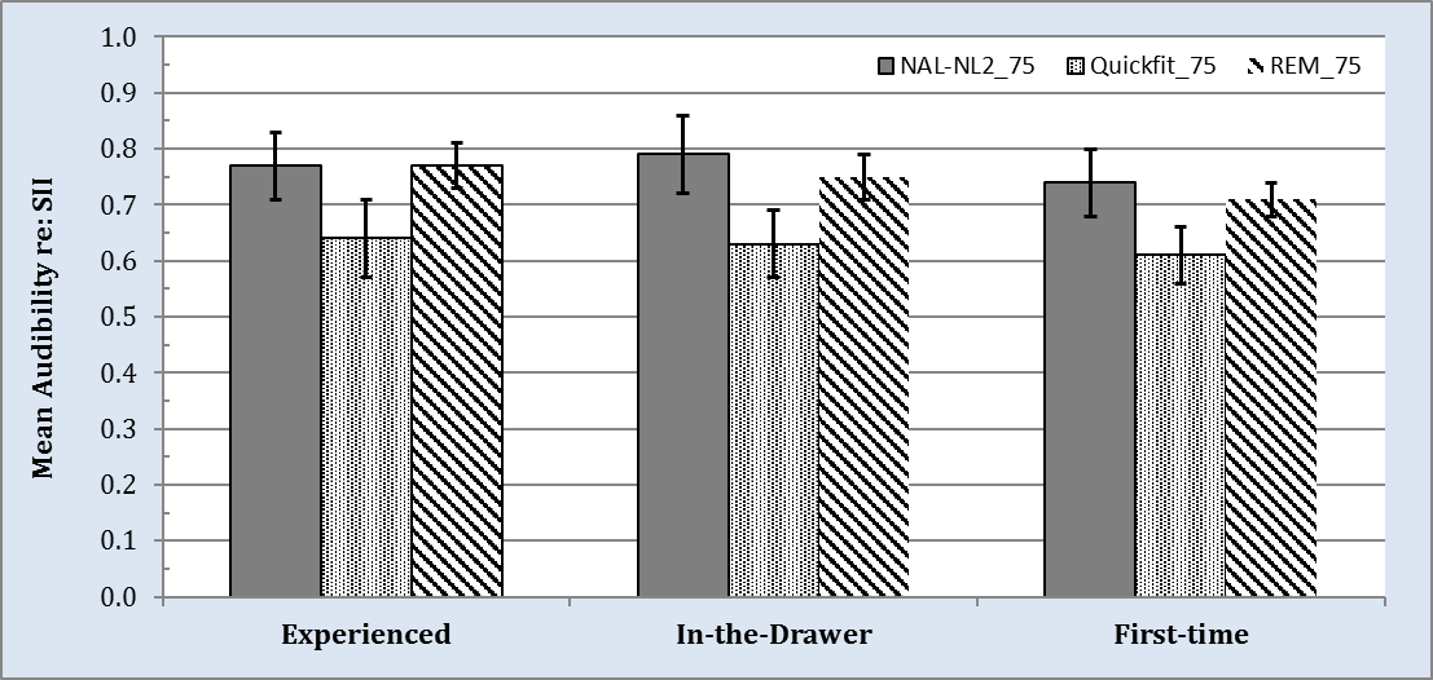
Figure 8. Speech intelligibility index (SII) values obtained at a 75-dB input level for NAL-NL2 target provided by Verifit2 (ie, gray bars), Quick-Fit approach (ie, black and white dotted bars), and REM approach (ie, black and white downward striped bars). Variability (ie, 95% confidence intervals) is shown as error bars.
At an input level 55-dB SPL, mean audibility per the SII for the NAL-NL2 target (gray bars in Figure 6) ranged between .57 and .61 across the three groups. Results for the Quick-Fit approach revealed a decrease in mean audibility compared to the NAL-NL2 target, ranging from .10 to .16 (black and white dotted bars). This decrease for the Quick-Fit approach compared to the NAL-NL2 target was statistically significant (t(1) = 4.11, p < .05). Conversely, mean audibility for the REM approach per the SII (black and white downward striped bars) deviated from target by < .02, which was not statistically significant (p > .05). An exact match to NAL-NL2 target SII values was not expected given that several participants requested small programming changes (~±5 dB from target) based on their sound-quality preferences as previously described.
Figures 7 and 8 depict mean audibility re: SII across the same conditions and groups, but at input levels of 65- and 75-dB SPL, respectively. Note that, as input level is increased, audibility as represented by the SII also increases for all three conditions. Regardless, data trends continue to reveal that the Quick-Fit approach results in SII scores that are ~.10 less than the REM approach, which was found to be statistically significant in nearly every comparison.
Speech in Babble Performance
We also employed the CST in its intended format: for quantifying speech understanding performance in background noise. During the task, participants were tested individually in a sound-treated room while wearing the experimental hearing aids binaurally. Four loudspeakers were positioned at an equal distance (1 meter) relative to the center-head position of the participant. The participant was seated in the center of the room, facing a loudspeaker positioned at 0° azimuth. CST passages were presented from this loudspeaker at an overall RMS level of 75 dB SPL. Three additional loudspeakers were positioned at 90°, 180°, and 270° relative to the loudspeaker at 0° azimuth. The CST multi-talker babble was presented individually from these loudspeakers at 66.23 dB SPL, resulting in a combined overall RMS level of 71 dB SPL, or a signal-to-noise ratio (SNR) of +4 dB. Performance scores were transformed from percent-correct to rationalized arcsine units (rau).21 Percent and rau scores are similar between 15% and 85%, but the rau conversion is necessary to normalize the variance in performance at the two extreme ends.
Results from the aided testing is shown in Figure 9. For listeners in the Experienced and In-the-Drawer groups, mean speech understanding in noise performance was statistically better (p < .05) for the REM approach (striped bars) compared to the Quick-Fit approach (solid bars). For the First-Time group, mean speech understanding in noise performance showed a similar trend to the more-experienced aided listeners, but was found not to be statistically significant (p > .05) given large performance variability in this small sample size.
Relationship Between Audibility and Speech Understanding Performance
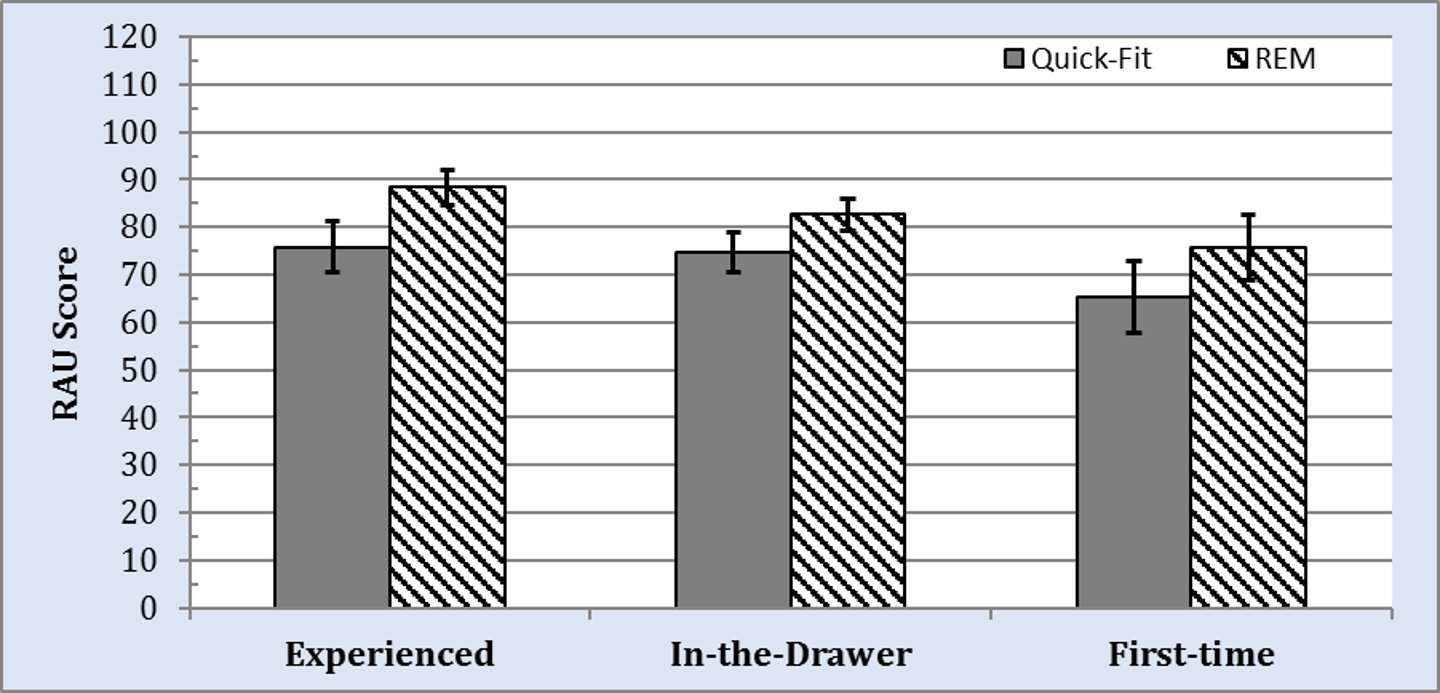
Figure 9. Mean aided speech understanding in noise performance (RAU scores), as measured by the Connected Speech Test, obtained for the Quick-Fit approach (ie, gray bars) and REM approach (ie, black and white downward striped bars) for the three groups. Variability (ie, 95% confidence intervals) is shown as error bars.
A core component for real-ear measurement is to ensure that the user is receiving appropriate amplification (ie, audibility) that would lend itself to an improvement in the user’s speech understanding performance. To that end, we undertook a correlational analysis that plotted SII as a function of CST performance. Specifically, we plotted the SII data for 75 dB SPL against the CST, where the speech passage was also presented at 75 dB SPL.
The outcomes for the data from each group are shown in Figures 10a-c. Within each panel, the black filled circles represent data plotted for the Quick-Fit approach, while the blue, filled diamonds represent data plotted for the REM approach. For all three groups, trends suggest that, as audibility increased, speech-intelligibility performance also increased.
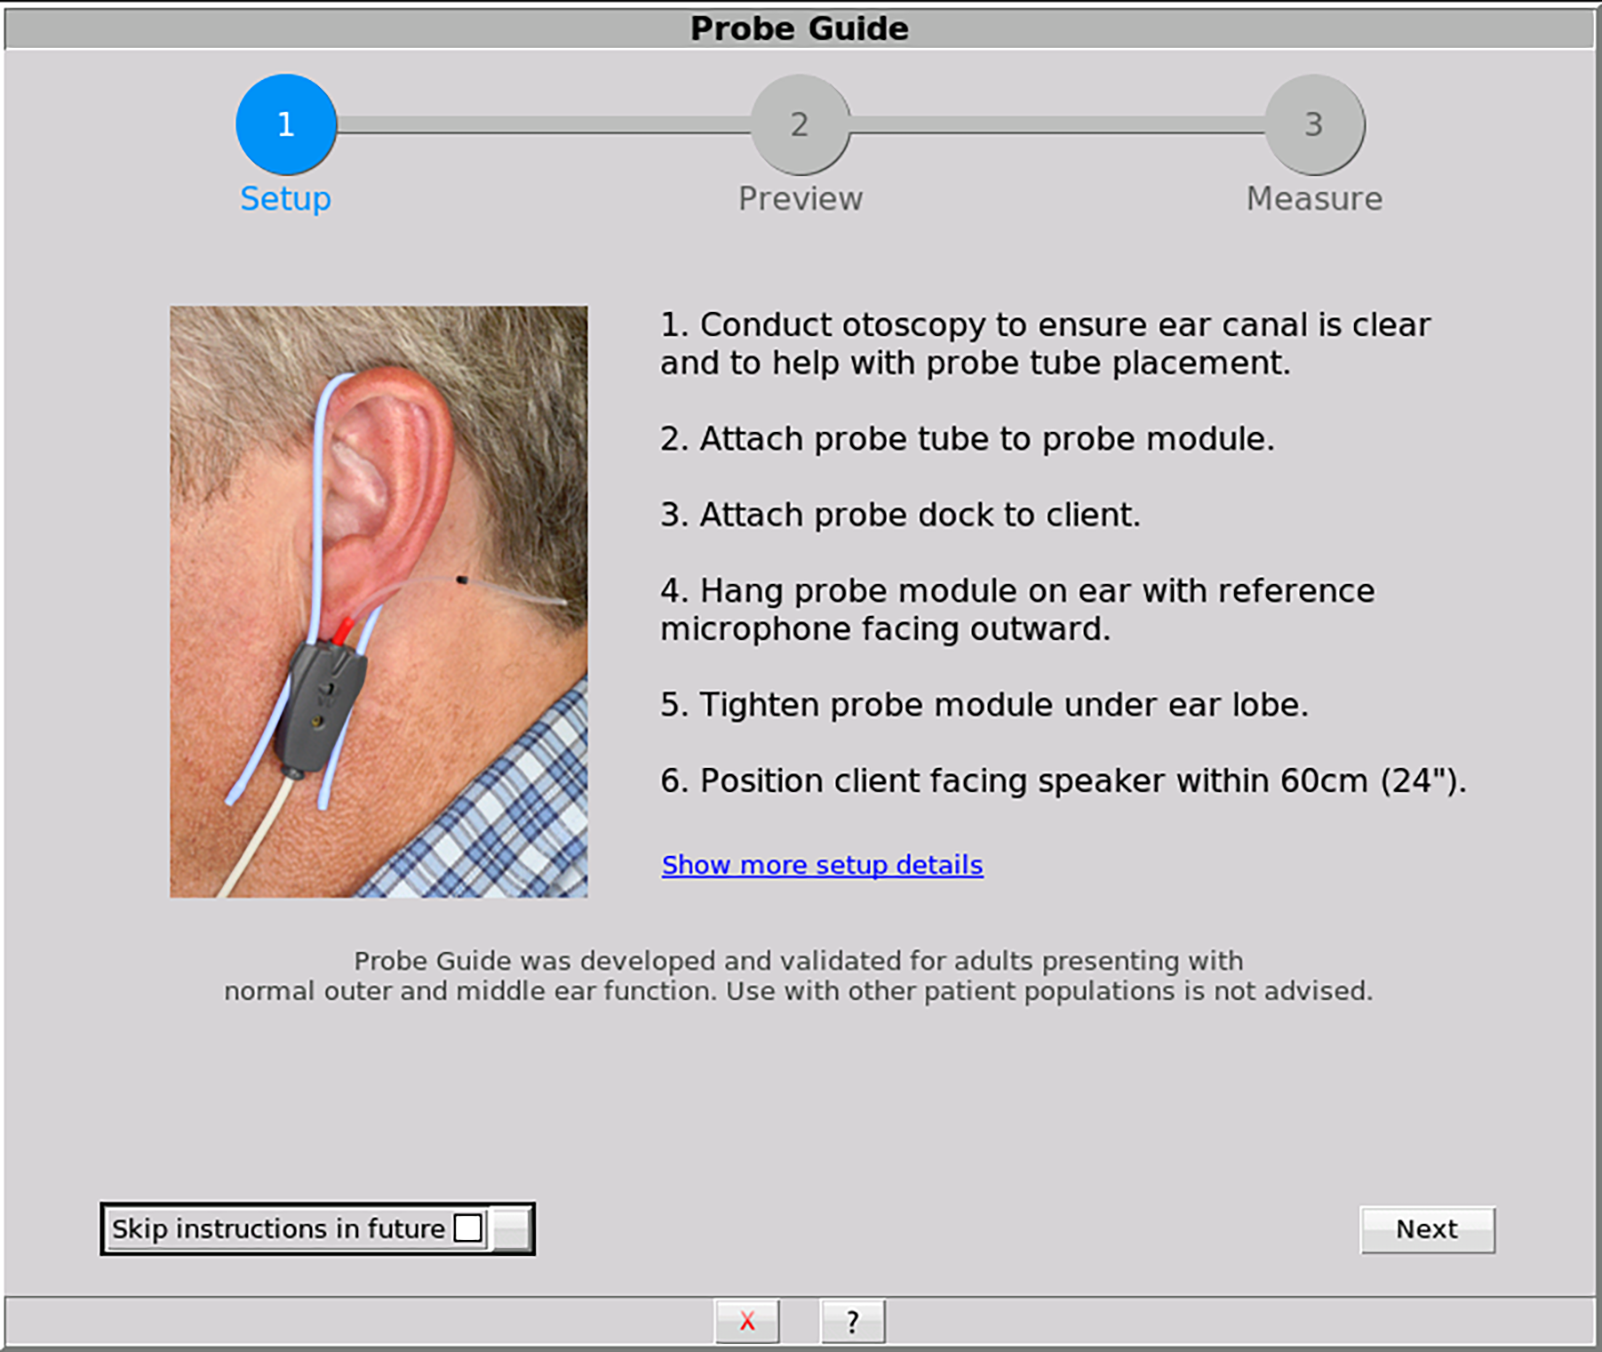
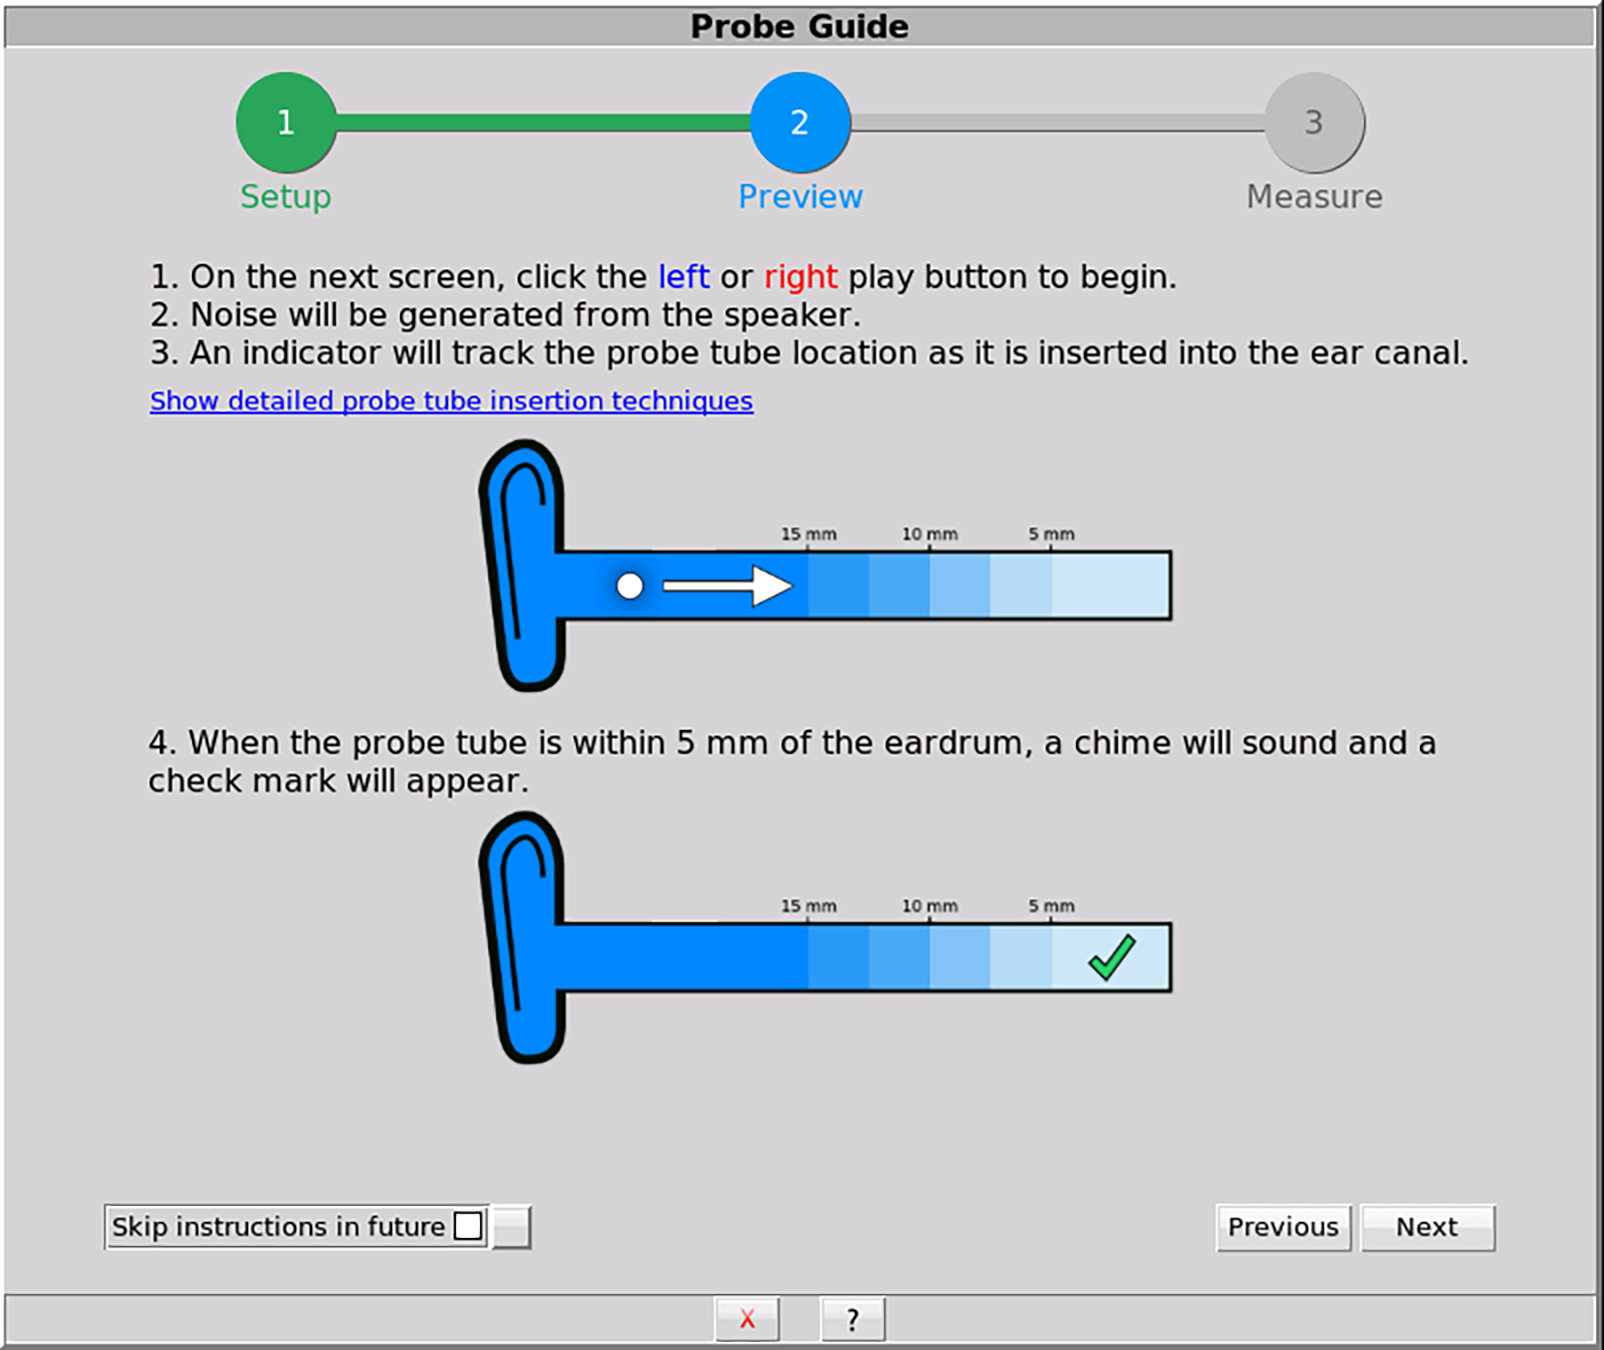
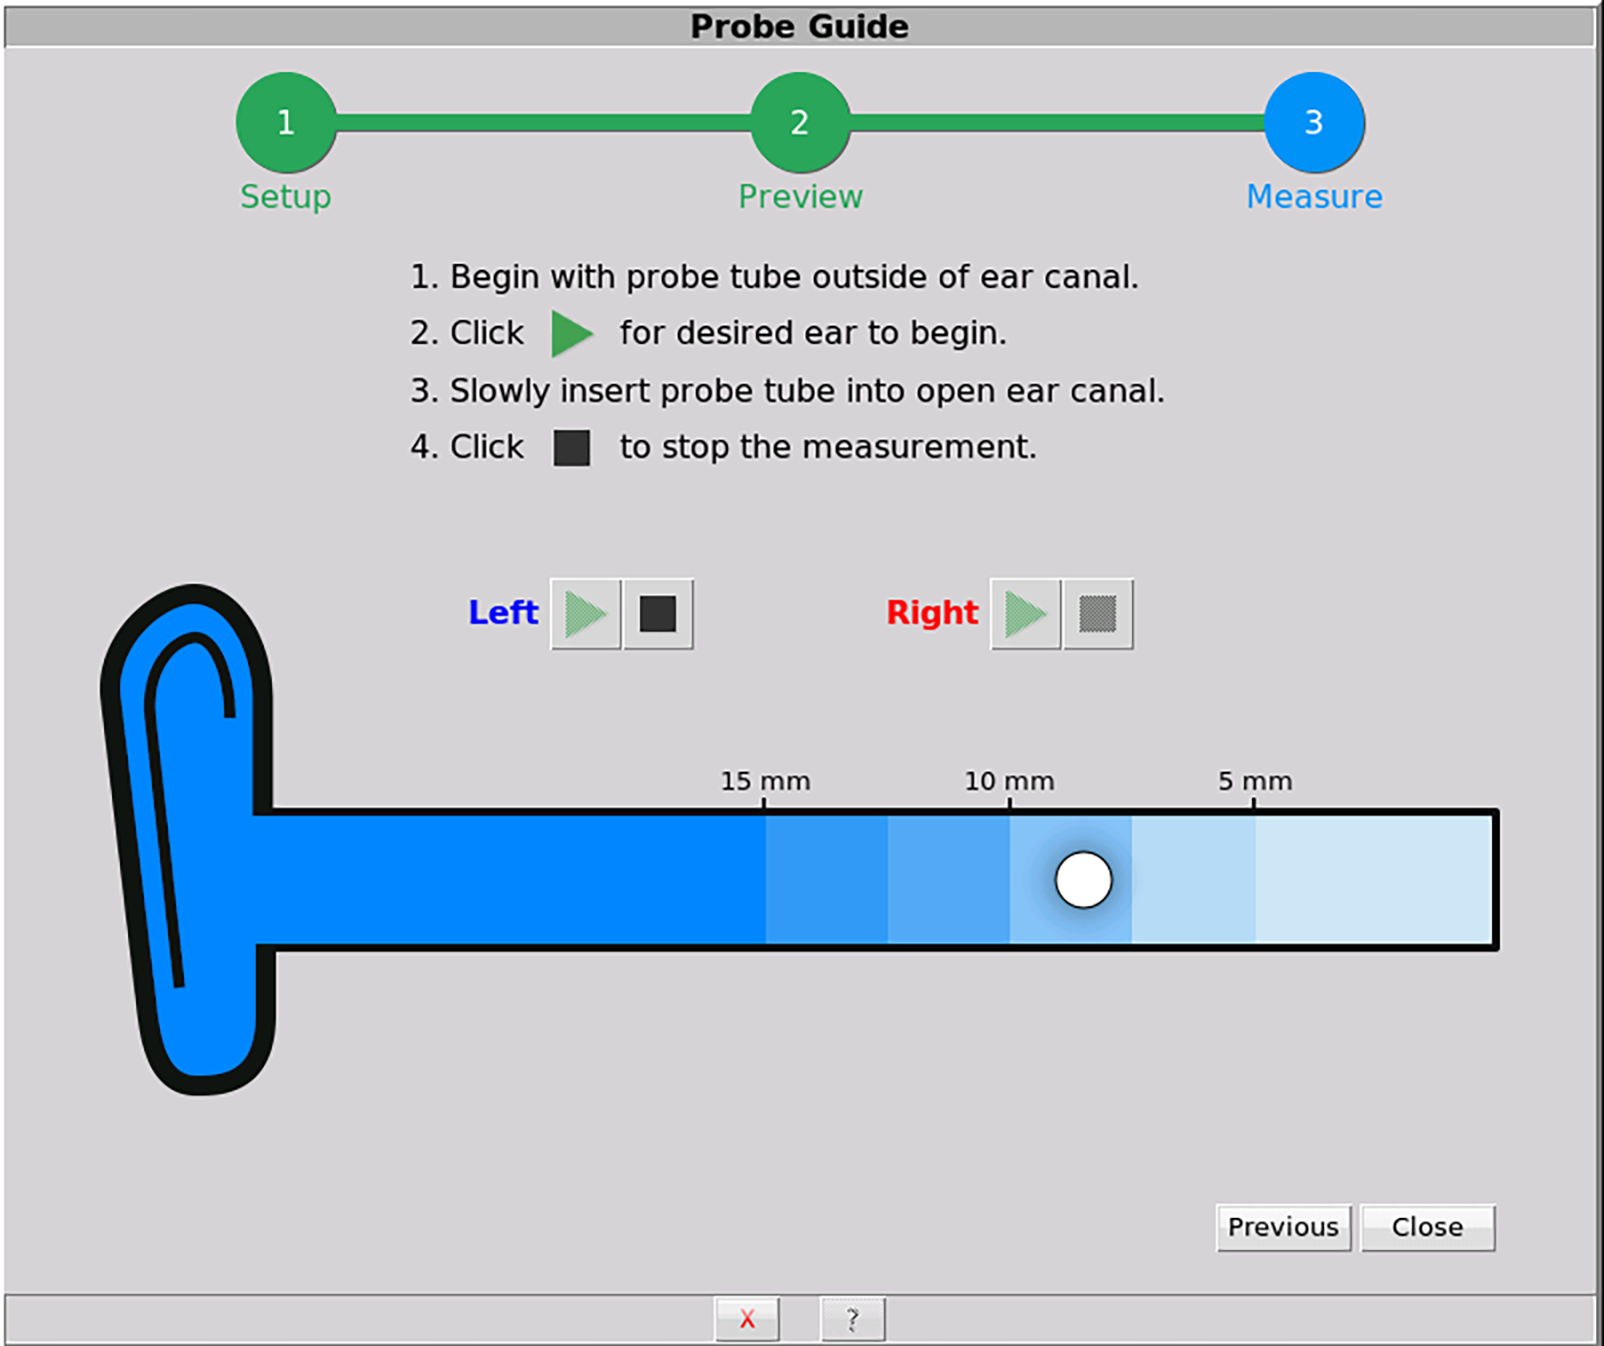
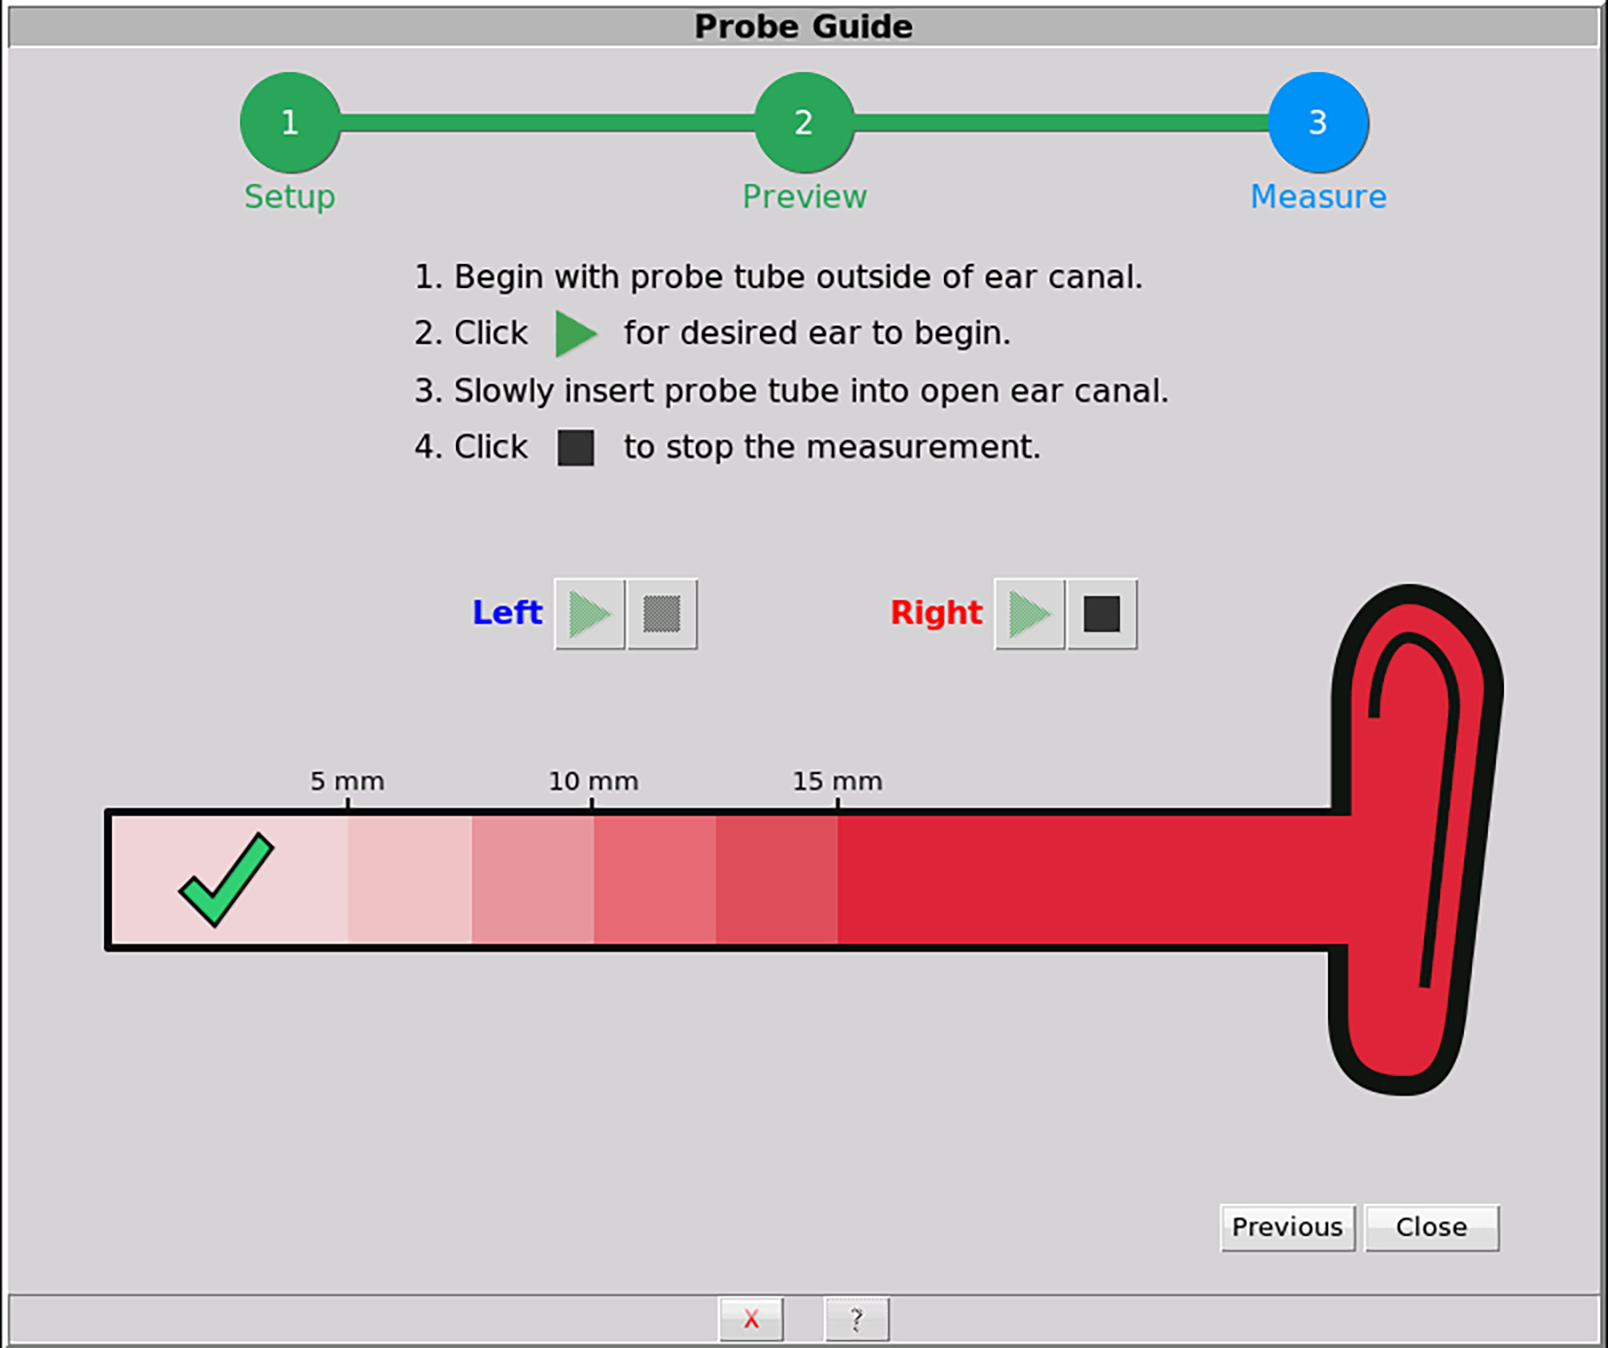
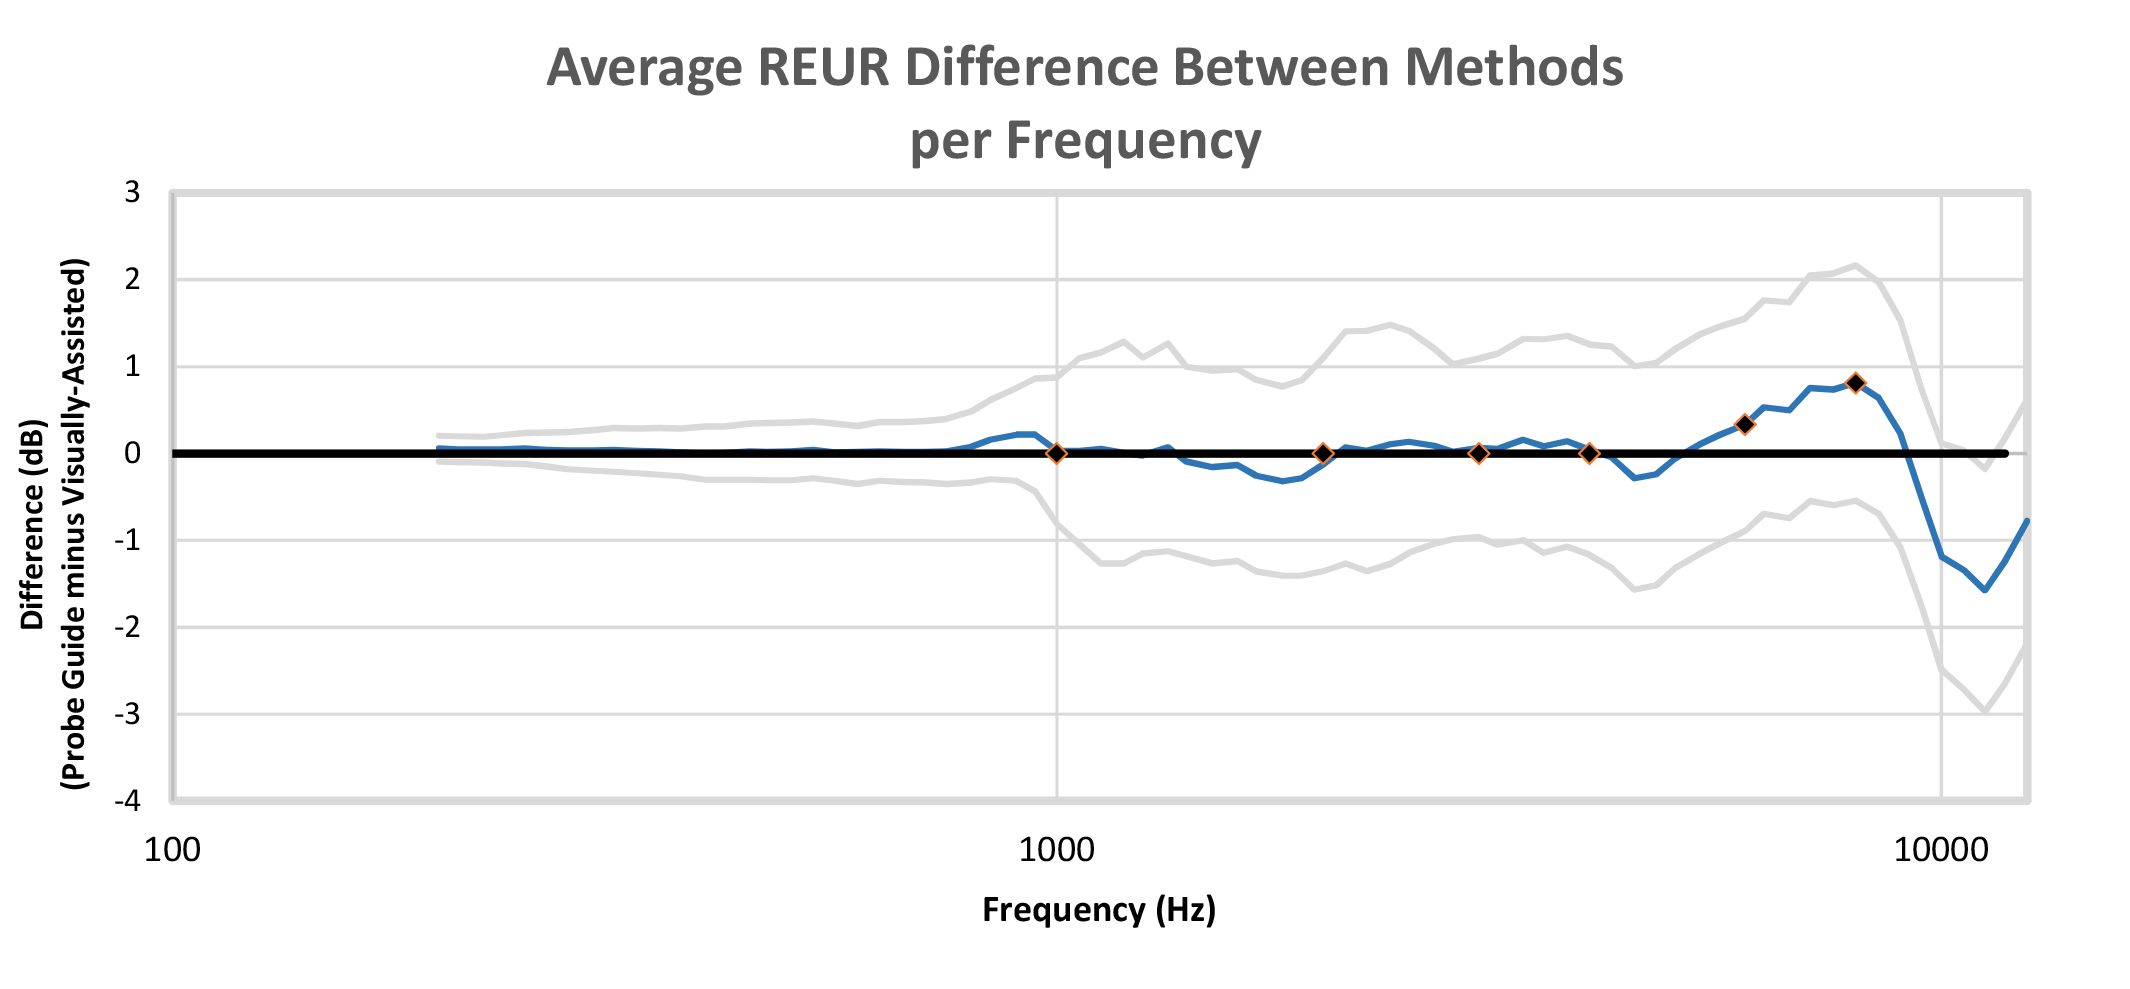
While a broadband noise signal is presented from the REM loudspeakers, the spectrum of sound within the ear canal is repeatedly sampled, analyzed, and input into a model of probe tube depth developed from a previously measured set of in-ear recordings. These recordings were gathered with normal adult ear canals as the probe tube was advanced to the correct location relative to the tympanic membrane.14 The machine-learning algorithm was “trained” to estimate probe tube depth from a sequence of input spectra, resulting in a software system that detects correct probe placement in real time.
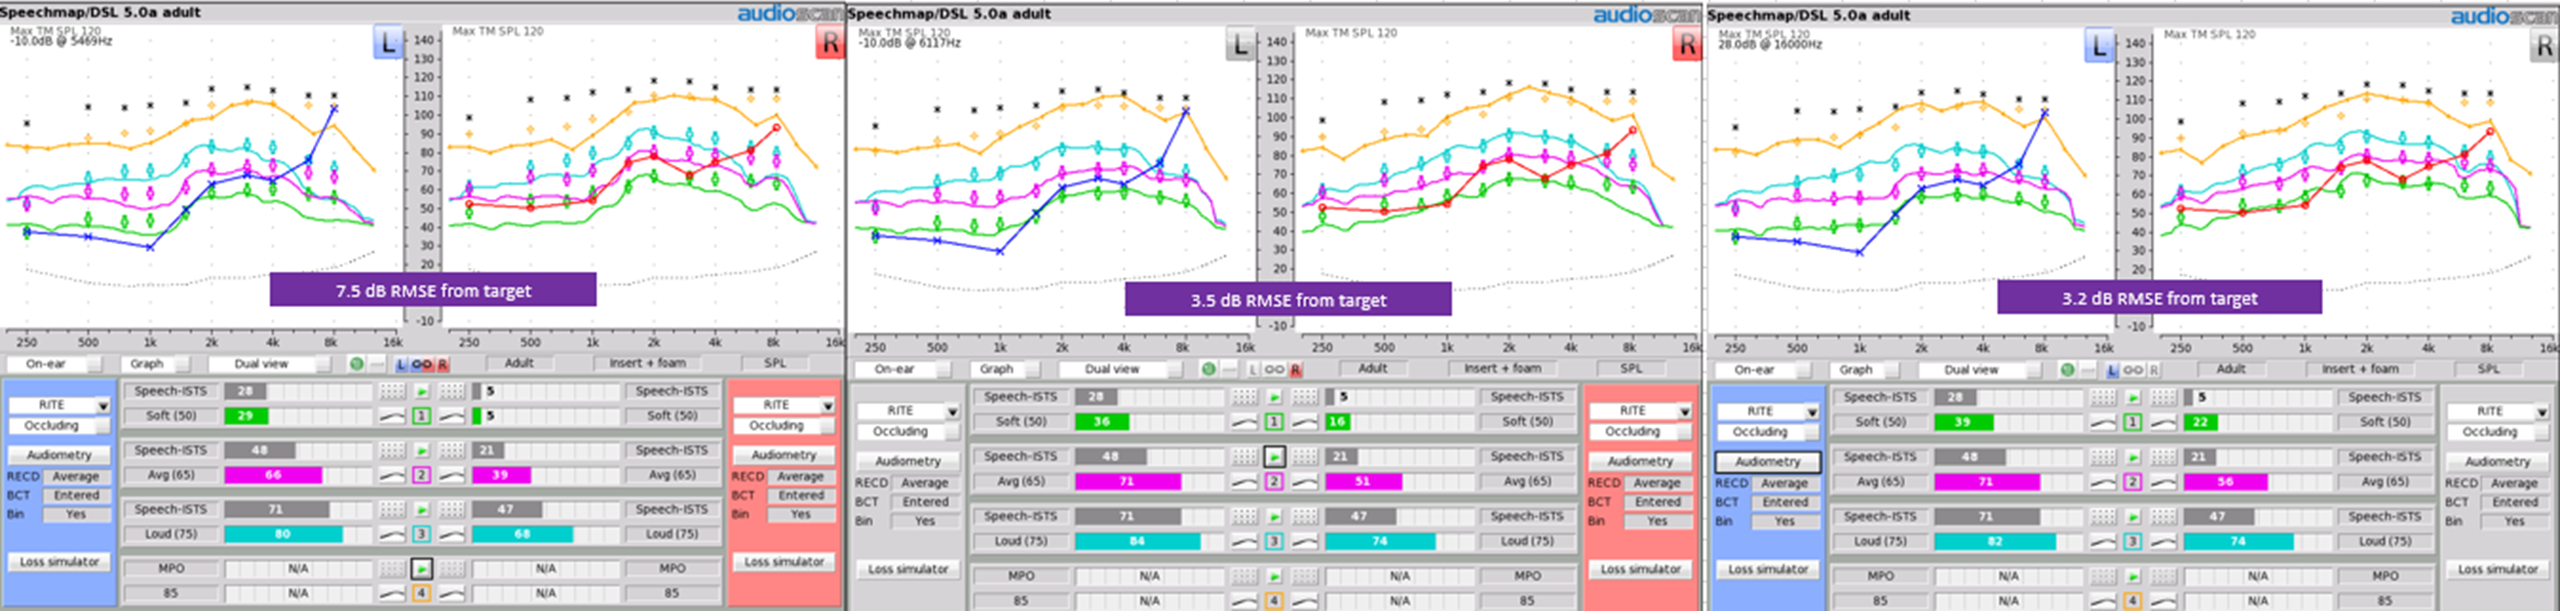
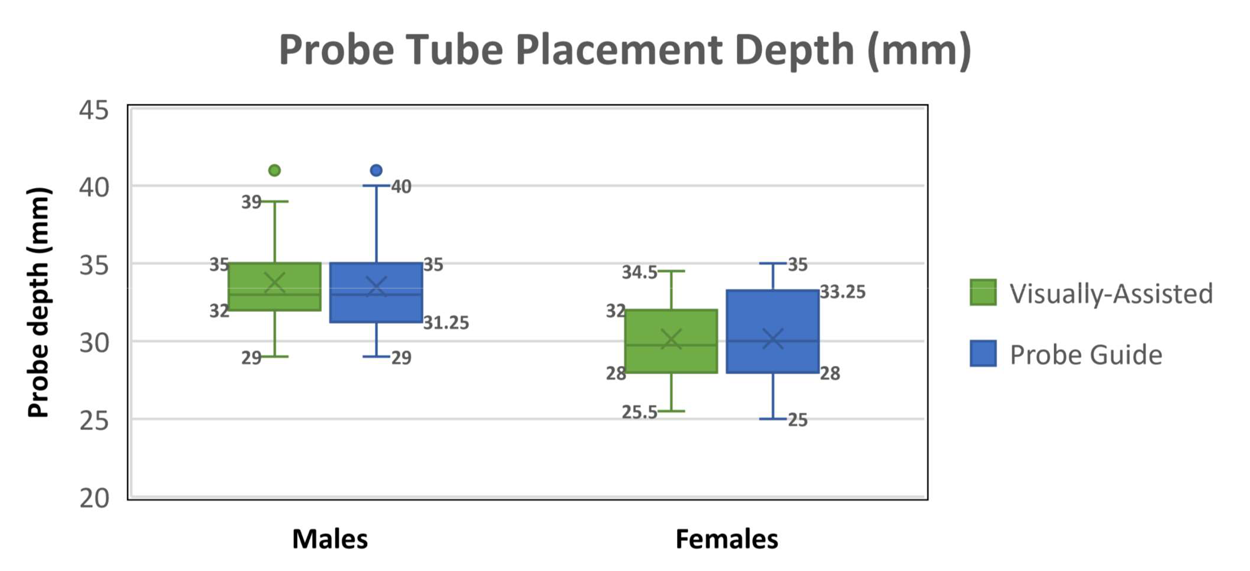
A typical next step in machine-learning tool development is to test the trained system on a new dataset to evaluate whether the trained system works on new patients. Therefore, the purpose of the following collaborative study was to validate the performance of Probe Guide on a new set of ears. Our goal was to determine the performance of this new tool by comparing measured probe tube insertion depths between Probe Guide and a clinician-appraised depth, the adequacy of REMs made with Probe Guide, and the presence of any procedural issues (eg, eardrum contact) obtained with Probe Guide (PG) versus an experienced audiologist using a traditional visually assisted (VA) method of probe tube placement.
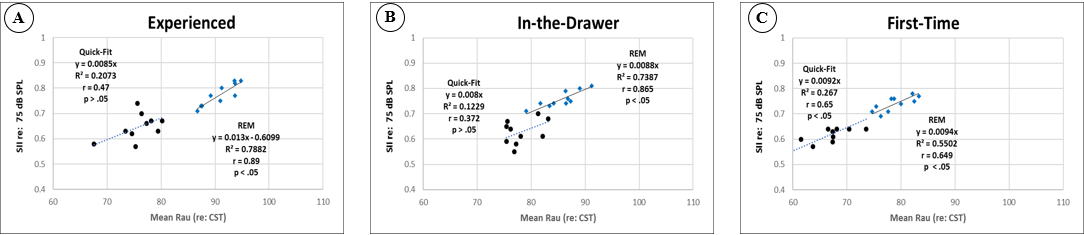
Figure 10a-c. Scatterplot showing the relationship between the mean SII, obtained at an input level of 75-dB SPL, and the Connected Speech Test (CST), with speech passages presented at 75 dB SPL and competing noise presented at 71 dB SPL. Panels A, B, and C display data for the Experienced, In-the-Drawer, and First-Time groups, respectively.
For the Experienced group who received the Quick-Fit approach, CST performance based on this fitting approach showed a moderate (r = 0.47) positive relationship between audibility and speech-intelligibility performance. This finding was not statistically significant (p > .05) and yielded a R2 of 0.21, indicating large variability between the variables. One reason for this outcome may be related to the fact that the Quick-Fit approach provided less gain in the high-frequency region compared to the NAL-NL2 target, as shown in Figure 3, thus compromising the listeners’ perception of consonant sounds. For listeners in the Experienced group who received the REM approach, CST performance based on this fitting approach showed a large (r = 0.89) positive relationship between audibility and speech-intelligibility performance. This outcome was statistically significant (p < .05) and yielded an R2 of 0.78, suggesting that as audibility improved, so did speech-intelligibility performance. Data analysis for the In-the-Drawer group yielded similar outcomes to the Experienced Group.
For the First-Time group who received the Quick-Fit approach, results revealed a statistically significant (p < .05) positive relationship (r = 0.65) between audibility and speech-intelligibility performance. For the REM approach, the data also indicated a statistically significant (p < .05) yet similar association (r = 0.65) between audibility and speech-intelligibility performance as the Quick-Fit approach. This finding is somewhat expected, given that increasing audibility should increase speech-intelligibility performance. The degree of improved speech-intelligibility, as a function of audibility, however, is not captured by this analysis. To illustrate, note that the First-Time group demonstrated smaller increases in speech-intelligibility compared to the Experienced and In-the-Drawer groups, even though audibility was similar among all three groups.
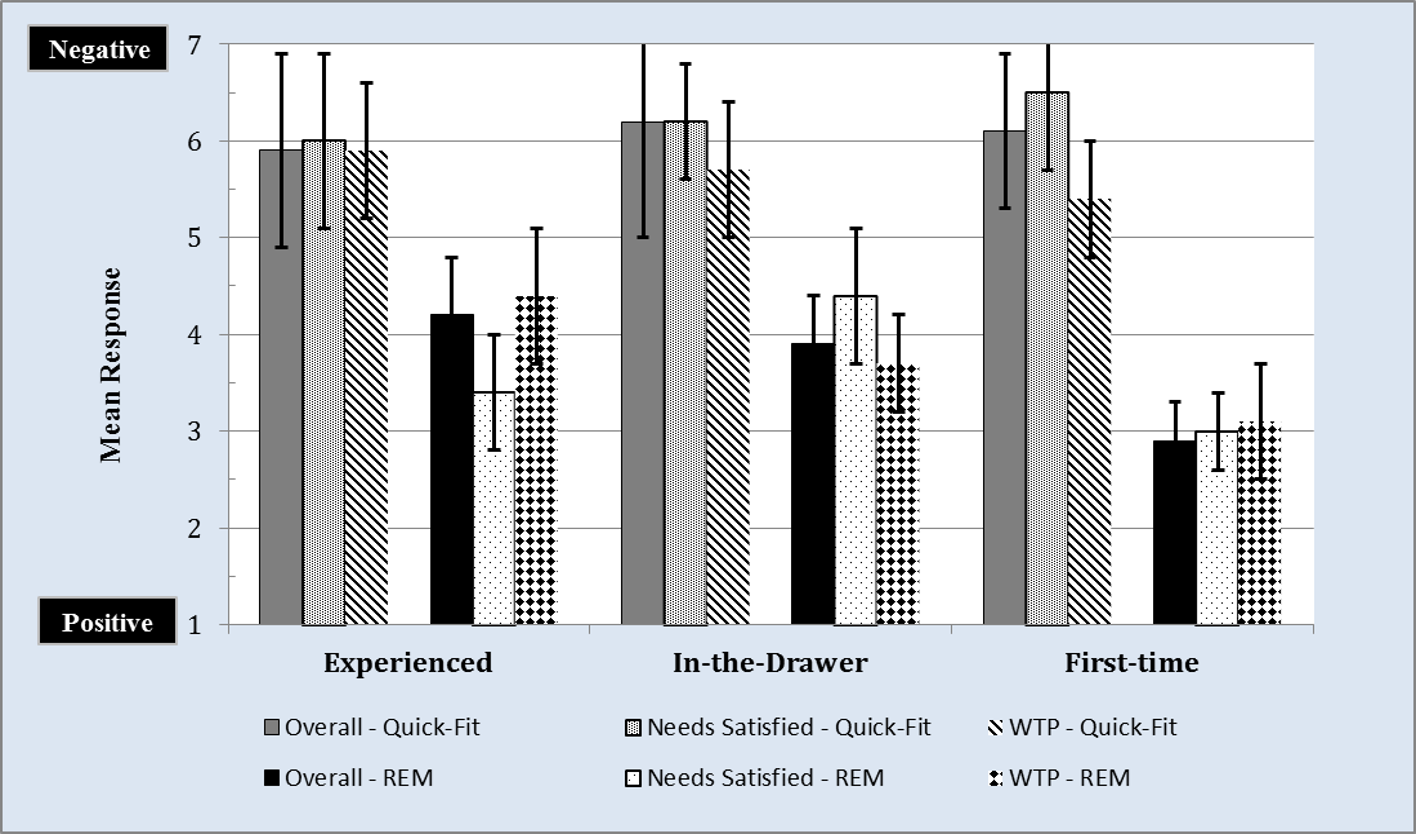
Consumer Loyalty: Advocacy
Consumer loyalty occurs when an individual consistently adopts a product or service from the same company over an extended period. In the hearing aid market, loyalty to the provider is roughly 50%, and reportedly stems from a lack of a standardized clinical protocol that includes REM as a professional service.22,23 In this study, we quantified the degree to which hearing aid service provision (ie, Quick-Fit vs REM) influenced patient perception towards the provider in three areas: advocacy (ie, positive perceptions that lead to advocacy of the business), purchasing (ie, degree to which consumers will increase purchase behavior), and retention (ie, degree to which consumers remain consumers of the same business). These areas were assessed using the previously described loyalty survey, and each participant was asked to provide a categorical response ranging from 1 (very likely) to 10 (not likely).
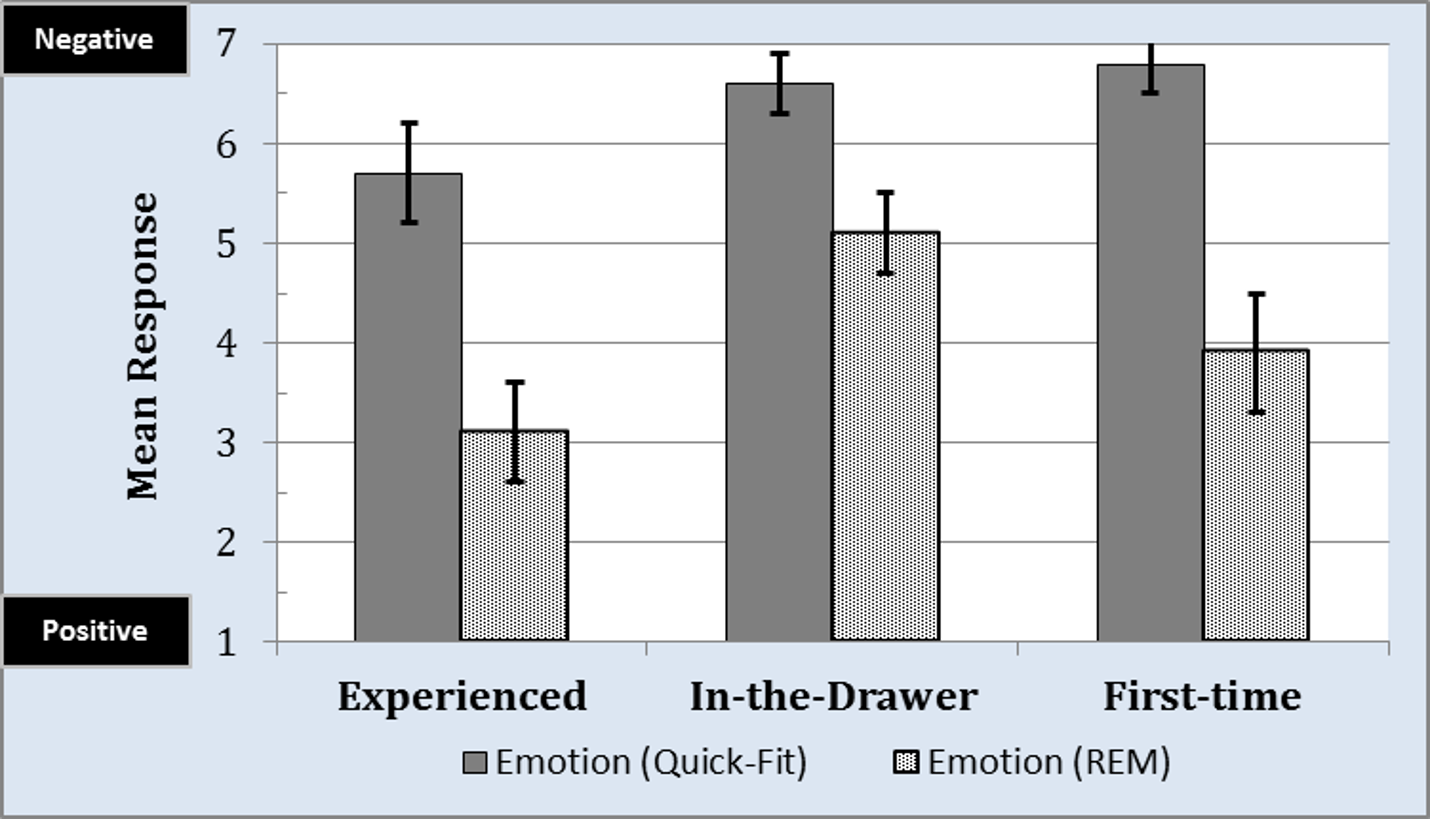
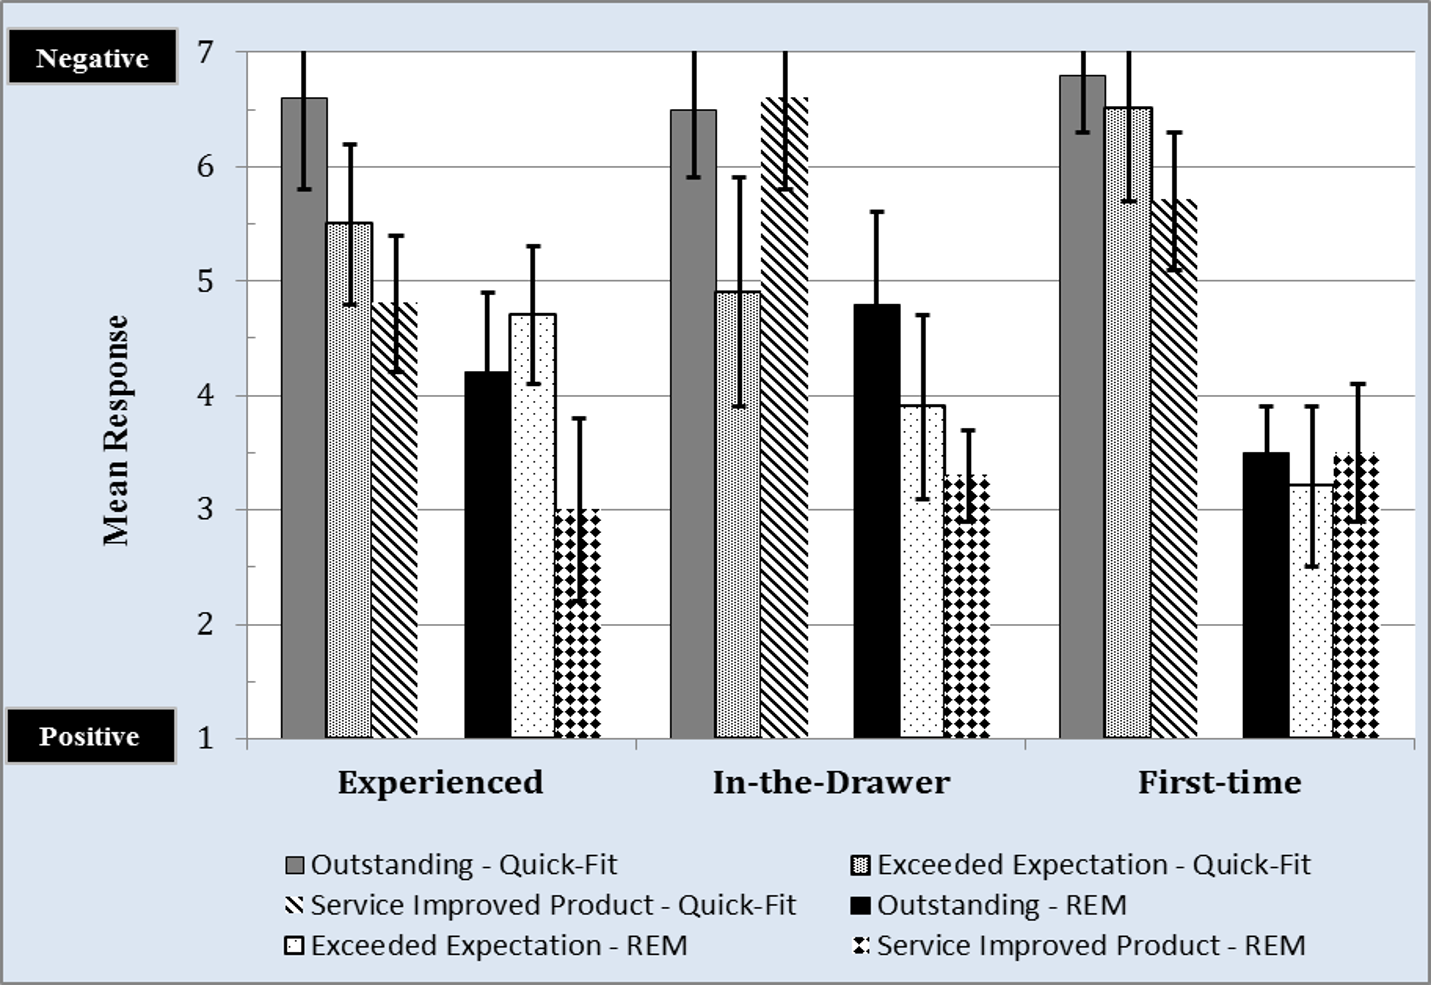
Figure 11 displays the mean responses for advocacy, a measure of emotional attachment towards the provider and practice as considered by the respondent. An increase in advocacy often coincides with an increase in overall satisfaction, referrals, and repurchase intent.
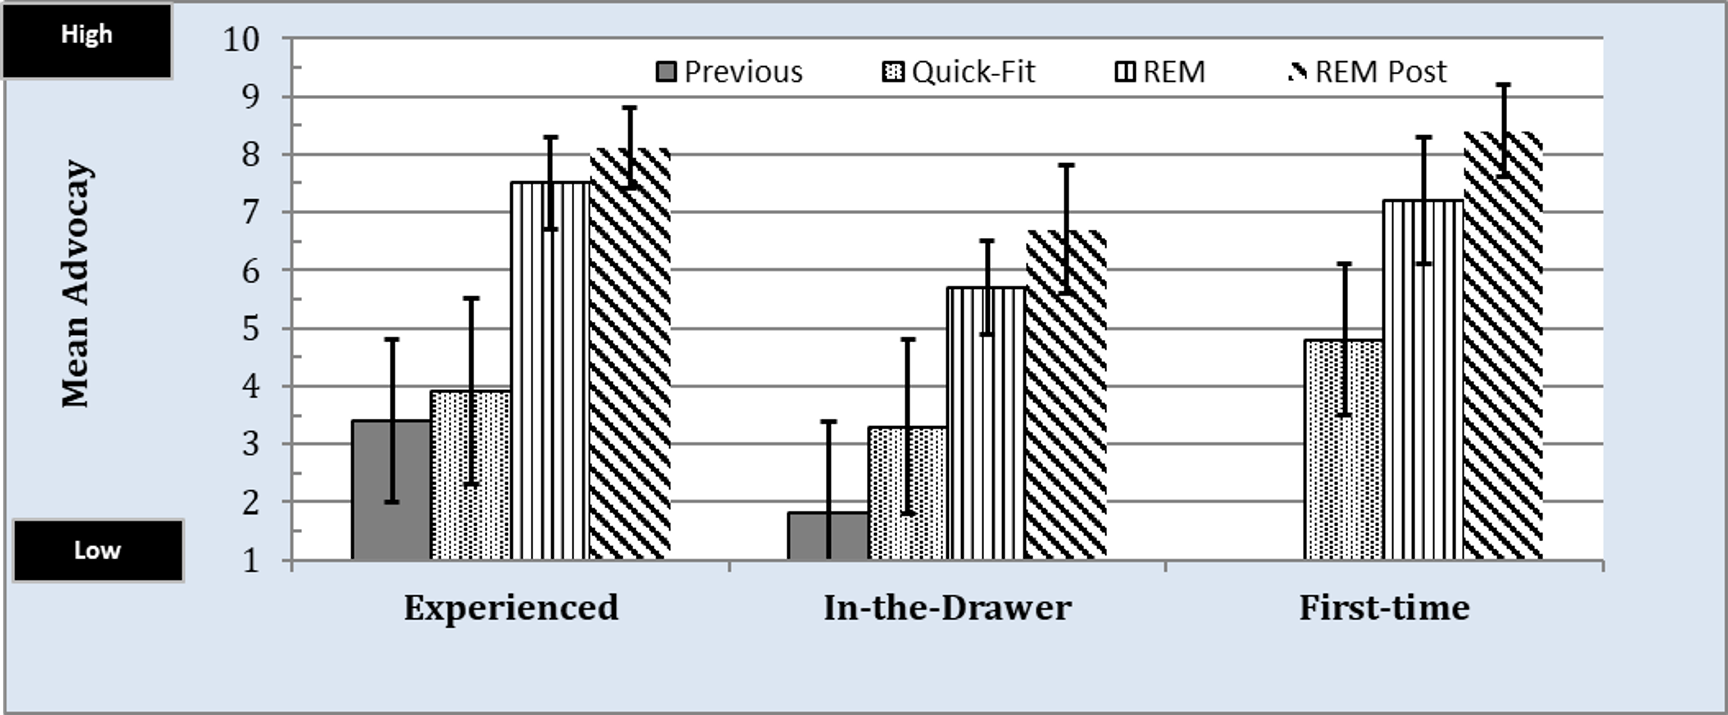
Figure 11. Mean loyalty, for the advocacy subscale, by group for professional services received for: 1) previous to participation in this study; 2) the Quick-Fit protocol; 3) the REM protocol, and 4) REM protocol received post Quick-Fit protocol. Values closer to 1 represent low loyalty and values closer to 10 represent high loyalty.
Overall, results revealed that participants in the Experienced group would not positively advocate for their previous provider given a mean response of 3.4 (ie, gray bar). The Quick-Fit approach, which was performed as part of this study, did not positively impact advocacy to any great extent (black and white dotted bar). Participants who received the REM approach during the study (black and white vertically striped bar), on the other hand, indicated a mean response of nearly 7.5. This finding, when compared to the Quick-Fit, was found to be statistically significant (Krusal-Wallis test; ?2(1) = 14.37, p < .001) and indicated increased patient advocacy towards the provider when REM was provided. When the participants who originally received the Quick-Fit approach were re-fit using the REM approach (ie, black and white diagonally striped bar), their ratings increased significantly (p < .05) by an average of 4.7—or from a mean of 3.4 to a mean of 8.1.
For the In-the-Drawer group, mean responses were mostly lower compared to that of the Experienced group. Advocacy responses to their previous provider tallied a mean of 1.8 (gray bar), while the Quick-Fit approach yielded a mean of 3.3 (black and white dotted bar). These differences were not statistically significant (p > .05). Participants who received the REM approach provided a mean response of 5.9 (black and white vertically striped bar), which was not perceived as a statistical improvement (Krusal-Wallis test; ?2(1) = 2.89, p > .05) compared to the Quick-Fit approach. Lastly, participants who originally received the Quick-Fit approach were re-fit using the REM approach and subsequently provided a mean of 6.4 (black and white diagonally striped bar), which was a statistical improvement over the Quick-Fit approach and similar to the participants who initially received the REM approach. An interesting observation about the In-the-Drawer group is the large variability in their responses. This observation highlights an empirical need to better understand the psychological make-up of this subpopulation as it relates to their previous hearing aid experiences.
Participants in the First-Time group provided mean advocacy scores of 4.8 and 7.2 for the Quick-Fit and REM approaches, respectively. The differences in these mean responses were found to be statistically significant (Krusal-Wallis test; ?2(1) = 16.09, p < .001). Listeners who received the Quick-Fit protocol and later were re-fit using the REM approach (black and white vertical striped bar), provided mean responses of 8.5, which was consistent (p < .05) with responses provided by listeners who received the REM protocol at the study’s outset.
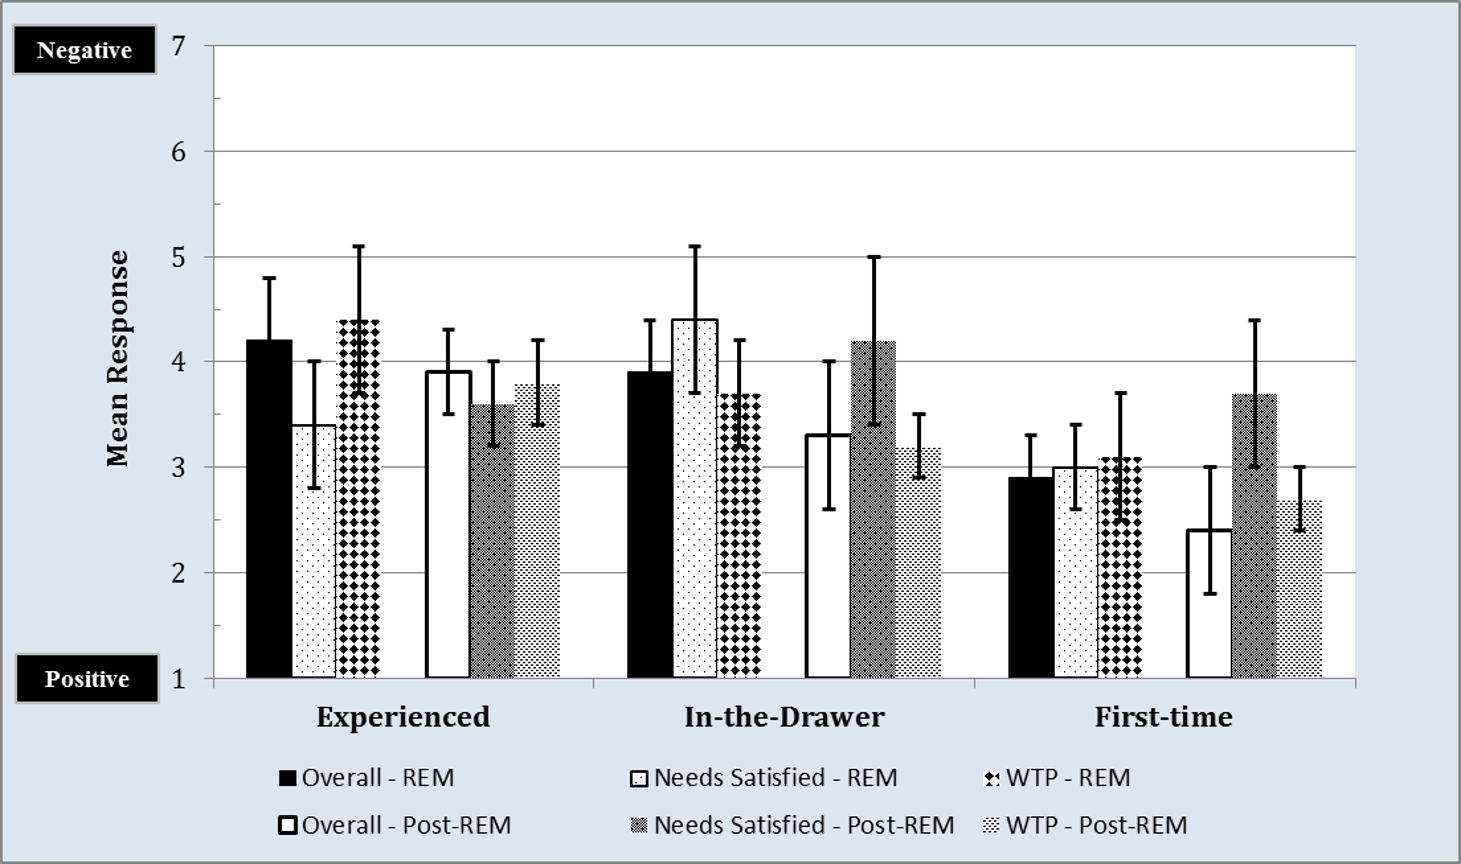
Consumer Loyalty: Purchasing
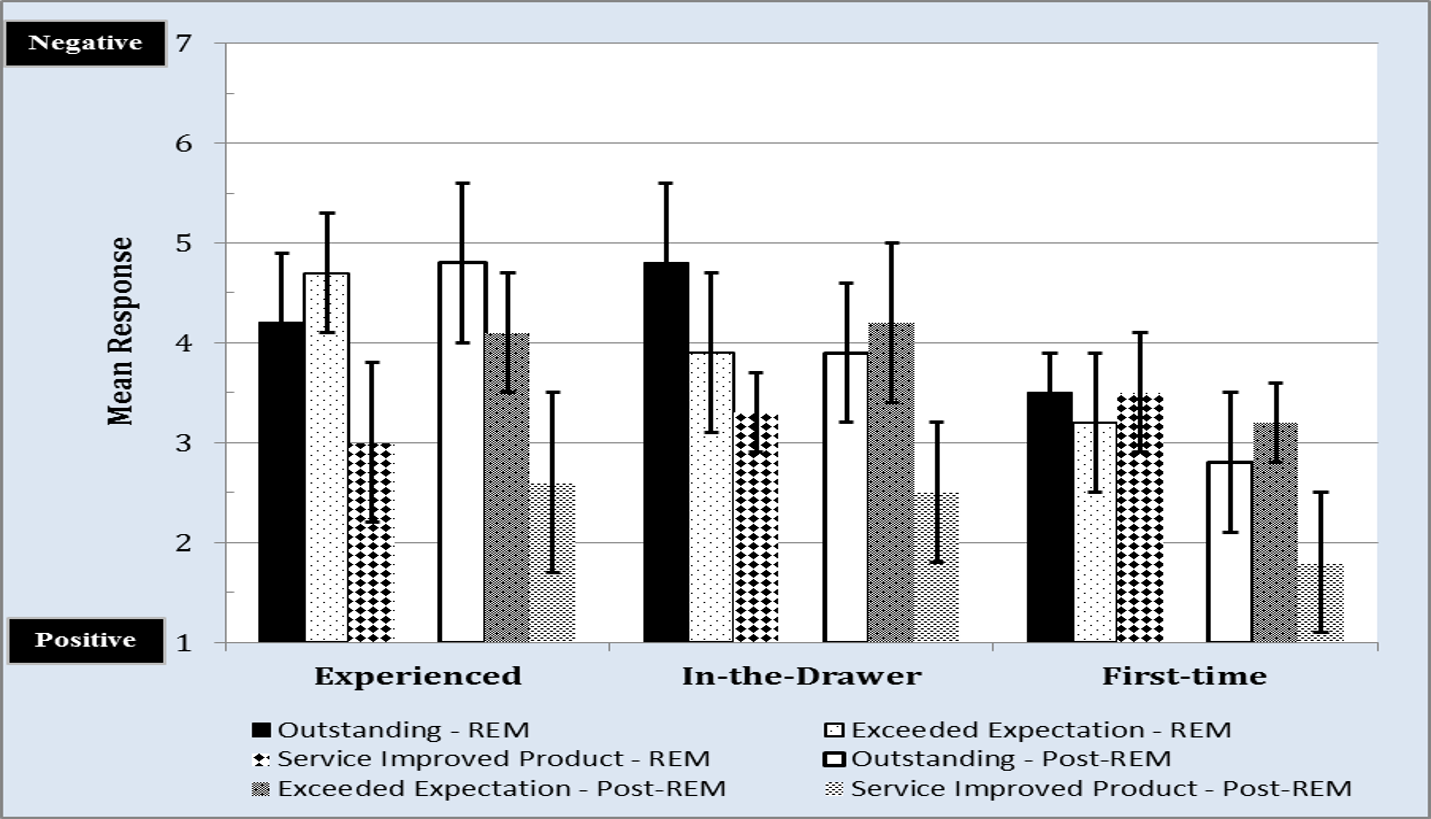
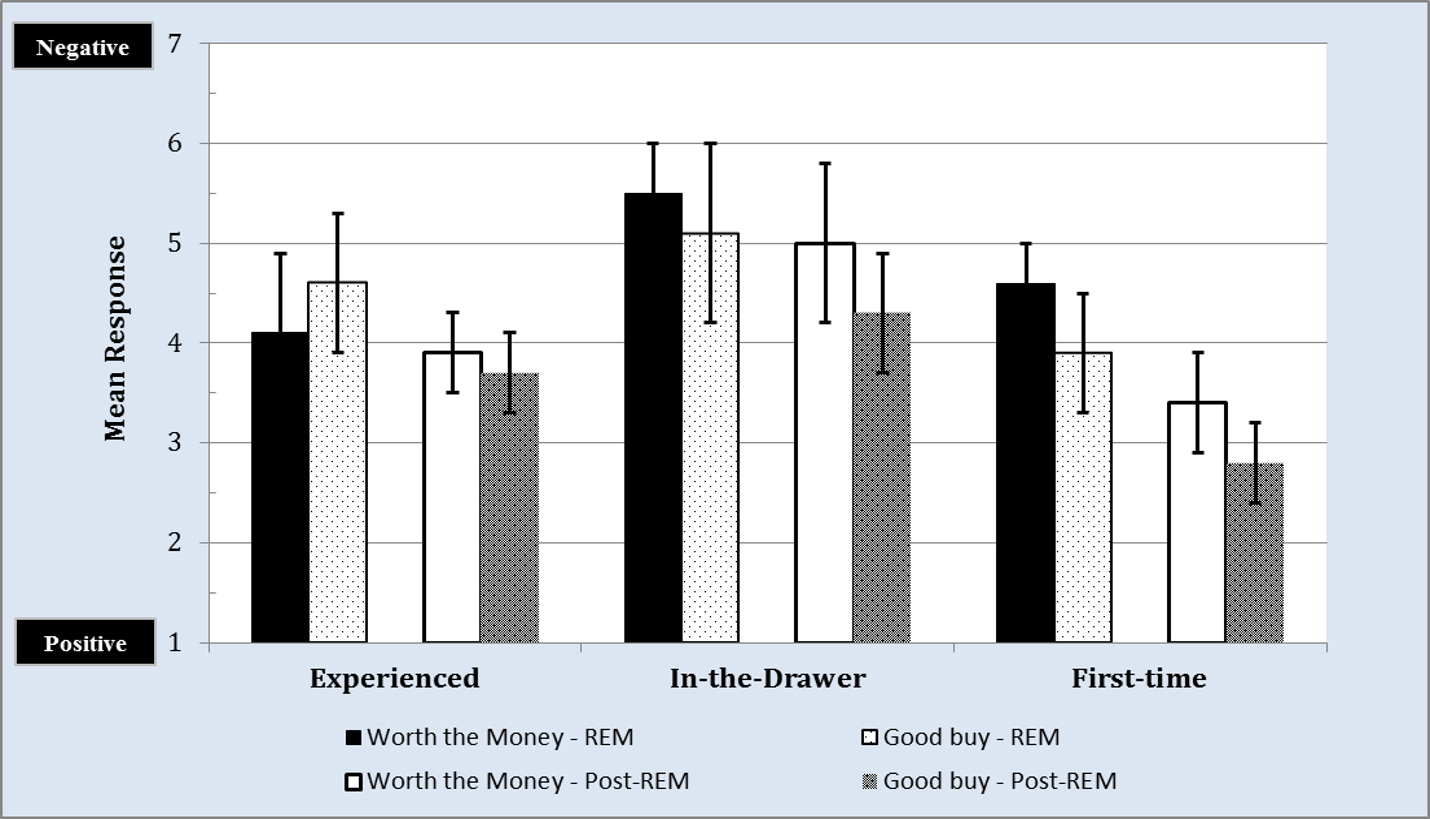
Purchasing behavior, shown in Figure 12, was the second factor of loyalty that we assessed. This scale documents the consumer’s intention to increase their purchasing behavior, either through increased willingness to pay or the purchase of additional products or services.
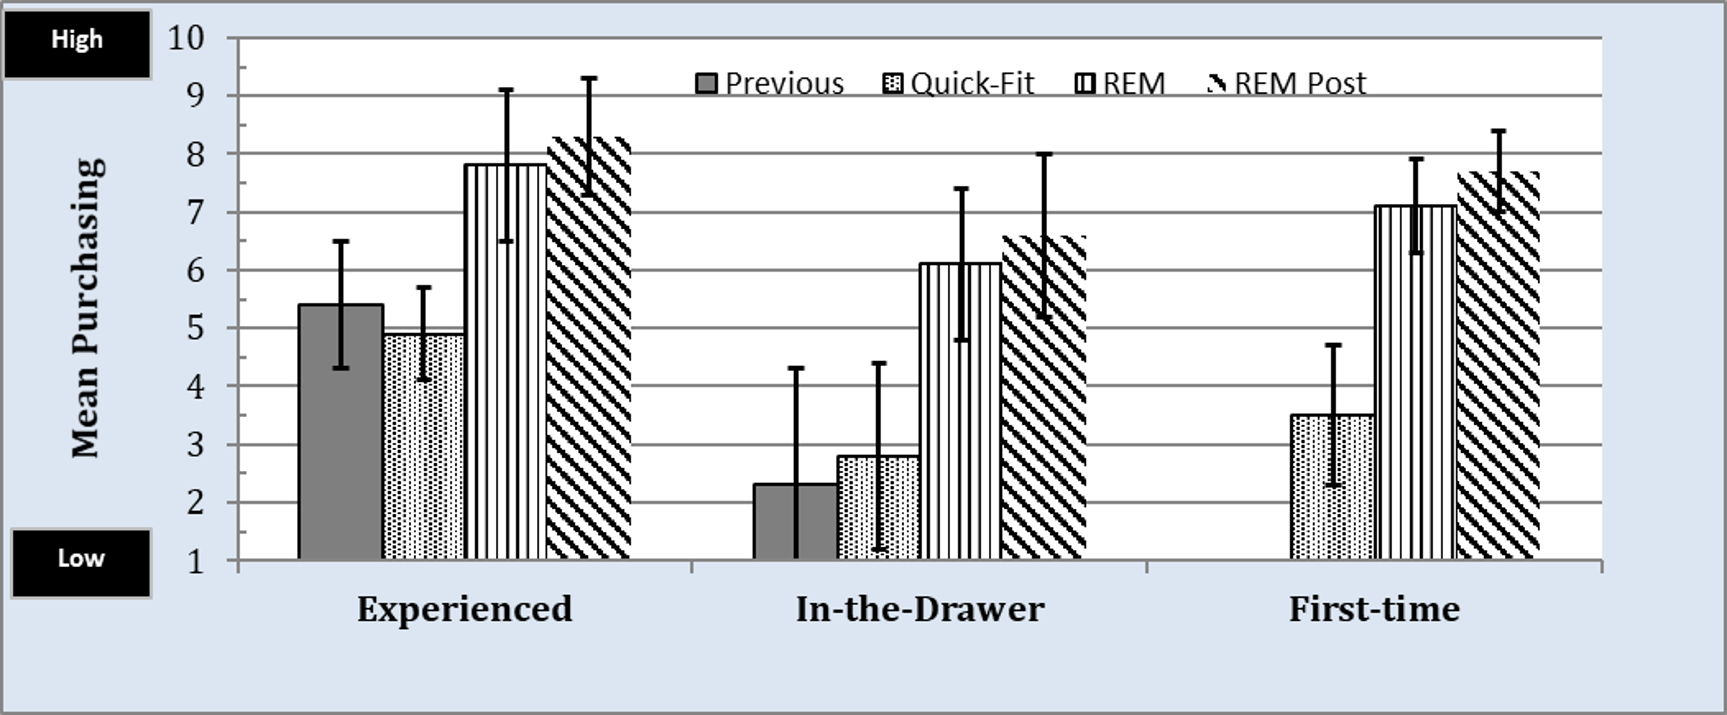
Figure 12. Mean loyalty, for the purchasing subscale, by group for professional services received for: 1) previous to participation in this study; 2) the Quick-Fit protocol; 3) the REM protocol, and 4) REM protocol received post Quick-Fit protocol. Values closer to 1 represent low loyalty and values closer to 10 represent high loyalty.
For the Experienced and In-the-Drawer groups, purchasing results revealed mean responses of 5.4 and 2.3 towards their previous provider (gray bars), respectively. Interestingly, mean responses for the Quick-Fit approach (black and white dotted bar) were found to be similar to previous experiences (gray bars) reported by these two groups. However, mean responses for the REM approach (black and white vertically striped bar), compared to the Quick-Fit approach resulted in an improvement by 2.9 and 3.3 for each group, respectively. This later finding was statistically significant (p < .05). Lastly, there was no statistically significant difference (p > .05) in mean responses between the REM approach performed at the outset of the study and the REM approach performed after the Quick-Fit approach for both groups. There is, however, a statistically significant difference (p < .05) between the Quick-Fit and REM approaches for both groups, indicating that the REM protocol increased the likelihood of hearing aid uptake (ie, purchasing intent) compared to the Quick-Fit approach. Similar trends were noted for the First-time group.
Together, these data support our earlier findings related to willingness-to-pay.16 Specifically, the REM approach, compared to the Quick-Fit approach, resulted in an enhanced perceived value towards the provider that lends itself to an increase in the acquisition of product and services offered.
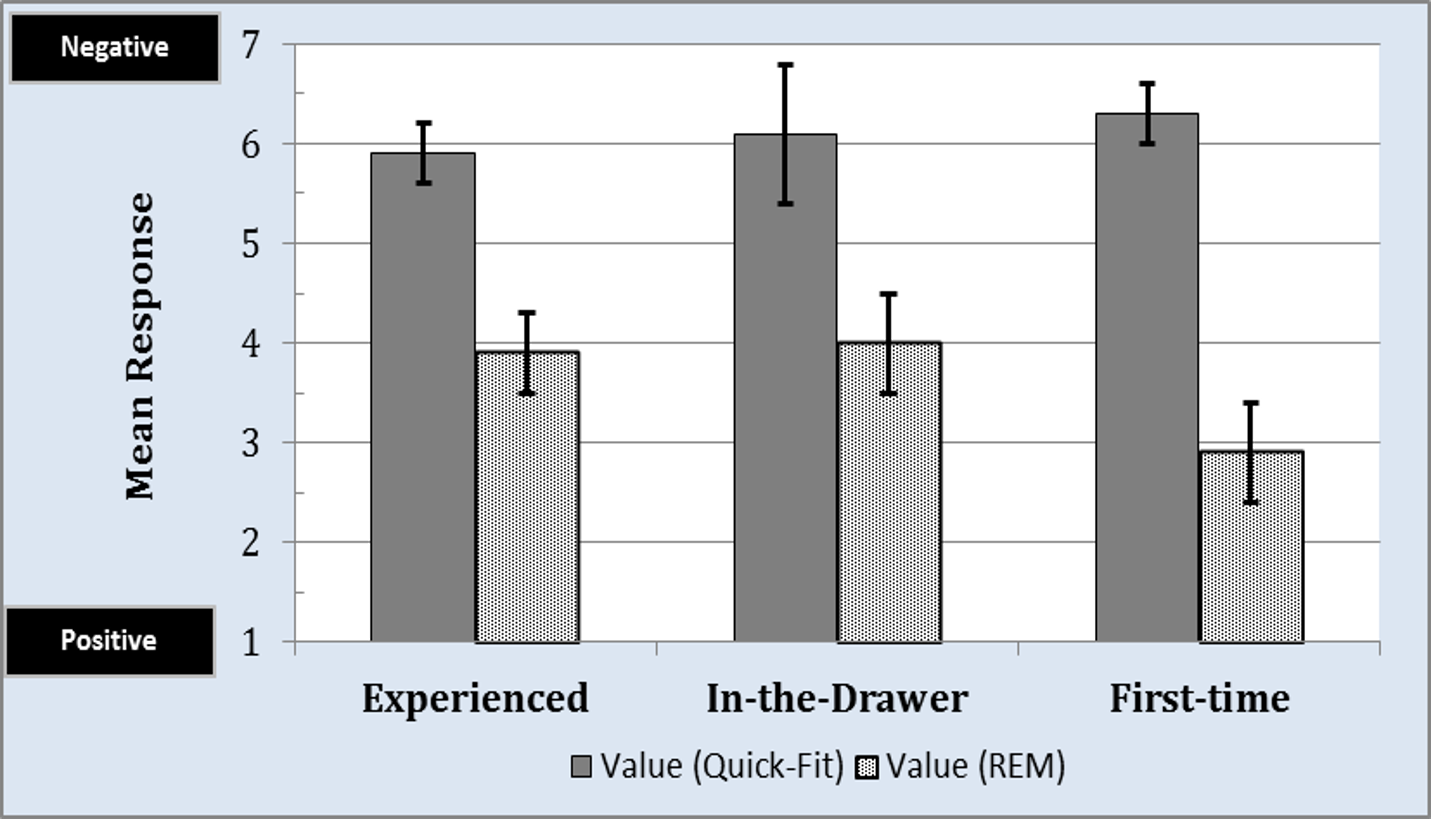
Consumer Loyalty: Retention
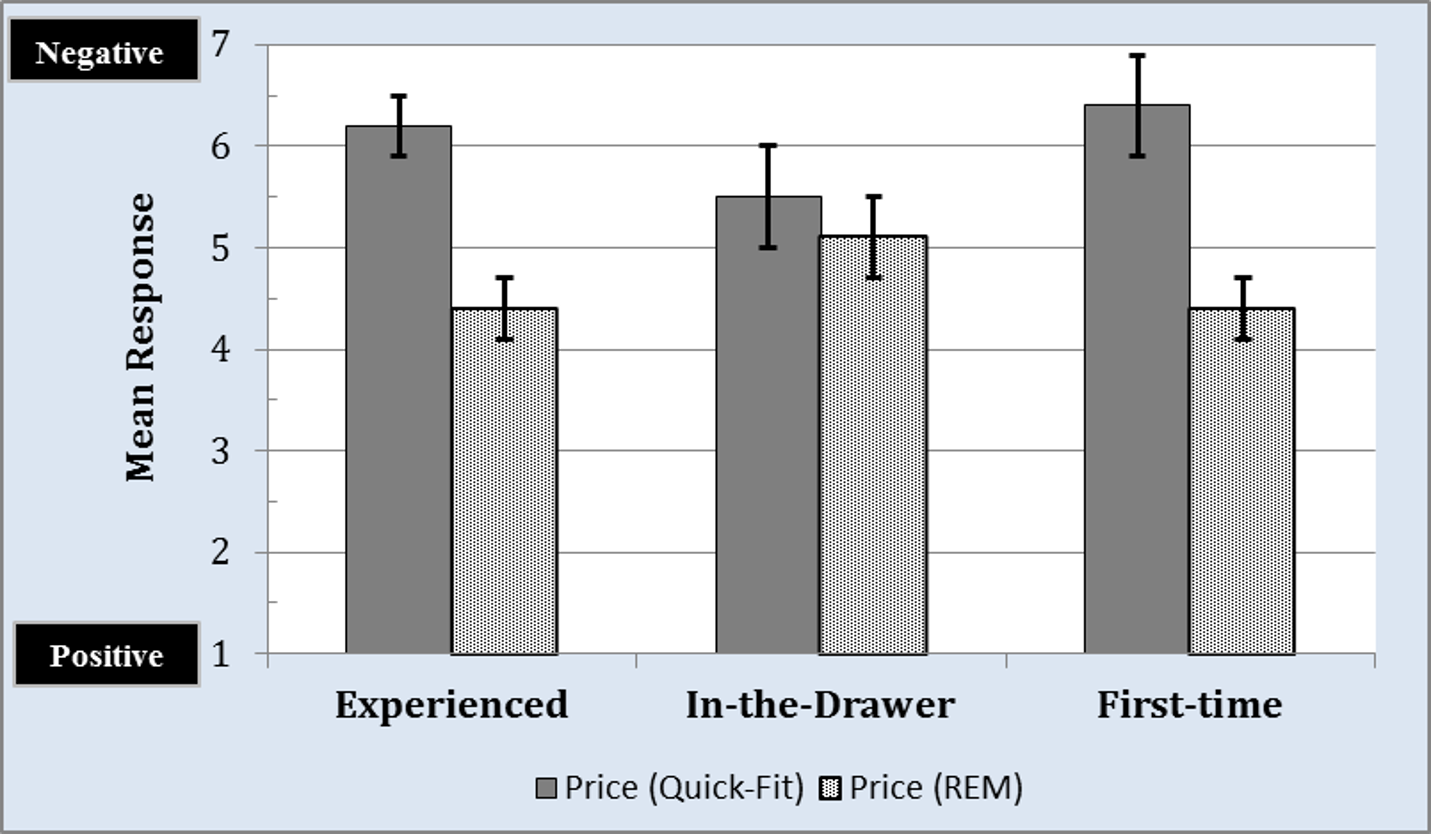
The final component of the loyalty scale is retention (Figure 13), the psychological assessment of value that compares the services and products rendered by one provider to the same services and products offered by the competition.
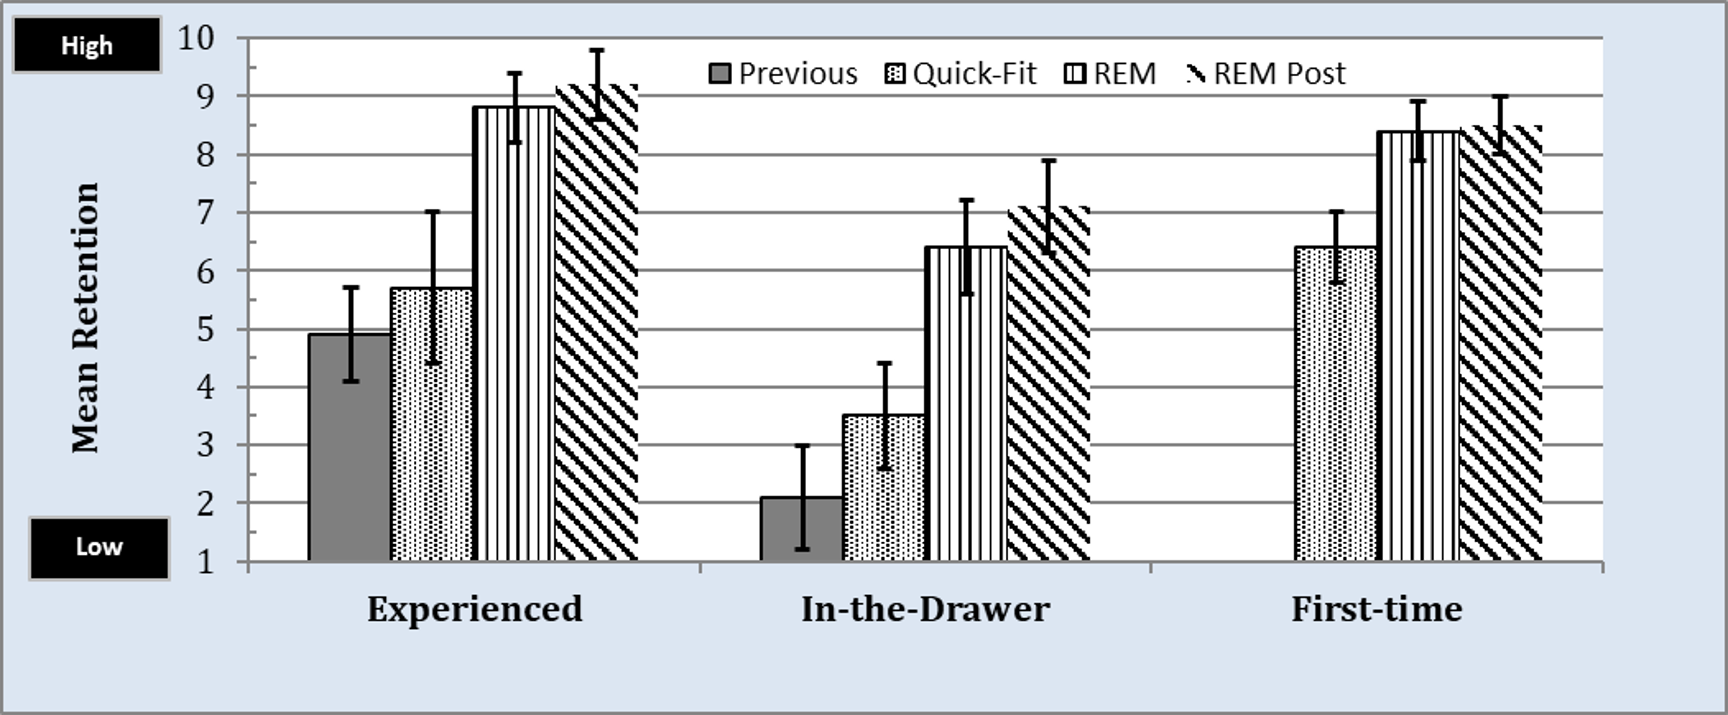
Figure 13. Mean loyalty, for the retention subscale, by group for professional services received for: 1) previous to participation in this study; 2) the Quick-Fit protocol; 3) the REM protocol, and 4) REM protocol received post Quick-Fit protocol. Values closer to 1 represent low loyalty and values closer to 10 represent high loyalty.
For all three groups, the data suggests that the REM approach (black and white vertically striped bars and black and white diagonally striped bars) provides a significant (p < .05) increase in retention compared to the Quick-Fit approach (ie, black and white dotted bar). In addition, the mean REM procedure yielded significant (p < .05) mean increases of 3.9 and 4.3 compared to previous experiences perceived by participants in the Experienced and In-the-Drawer groups, respectively. Lastly, there was no statistically significant difference (p > .05) in mean responses between the listeners who received the REM approach at the outset of the study (black and white vertically striped bar) and those who received the REM approach after the Quick-Fit approach (black and white diagonally striped bar).